- The 20-day Bollinger jaw has narrowed, indicating decreasing market volatility.
- The BCH/USD bulls are attempting to recover the losses of a bearish Wednesday.
BCH/USD daily chart
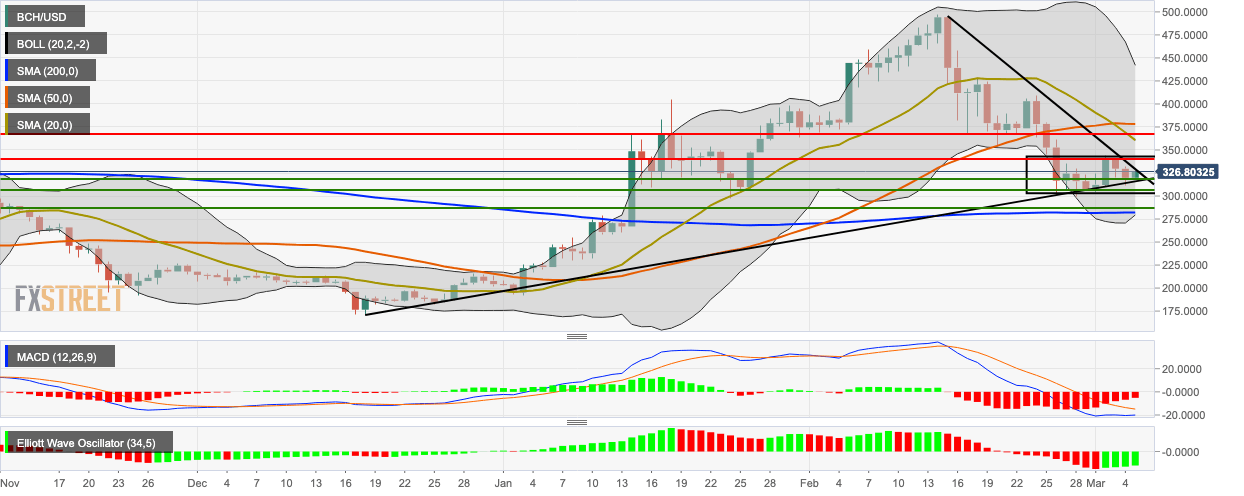
BCH/USD went up from $319.65 to $327.35 in the early hours of Thursday as the bulls attempt to recover the losses of this Wednesday. The price is hovering above the SMA 200 and below the SMA 20 and SMA 50 curves. The MACD indicates decreasing bullish momentum, while the Elliott Oscillator has had four straight green sessions. The bulls will want to push the price above the triangle formation.
