- The No. 5 sees a likely dead cat bounce after Saturday’s corrective slide.
- BCH/USD looks vulnerable, as the recovery lack follow-through.
- The spot is the top loser amongst the top 5 favorite crypto coins over 24 hours.
Bitcoin Cash (BCH/USD) stalls its recovery just shy of the 458 threshold, having witnessed a sharp pullback from near an eight-month peak of 496.96 clocked last Friday. The bulls lack follow-through, as they take cues from a similar tone seen across the crypto space this Sunday. Over the last hours, the price has entered a consolidative mode near the 450 level, reporting 2.20% gains on a daily basis while down 8.50% over the last 24 hours. The market capitalization for BCH/USD stands at $8.16 billion.
BCH/USD 1-hour chart
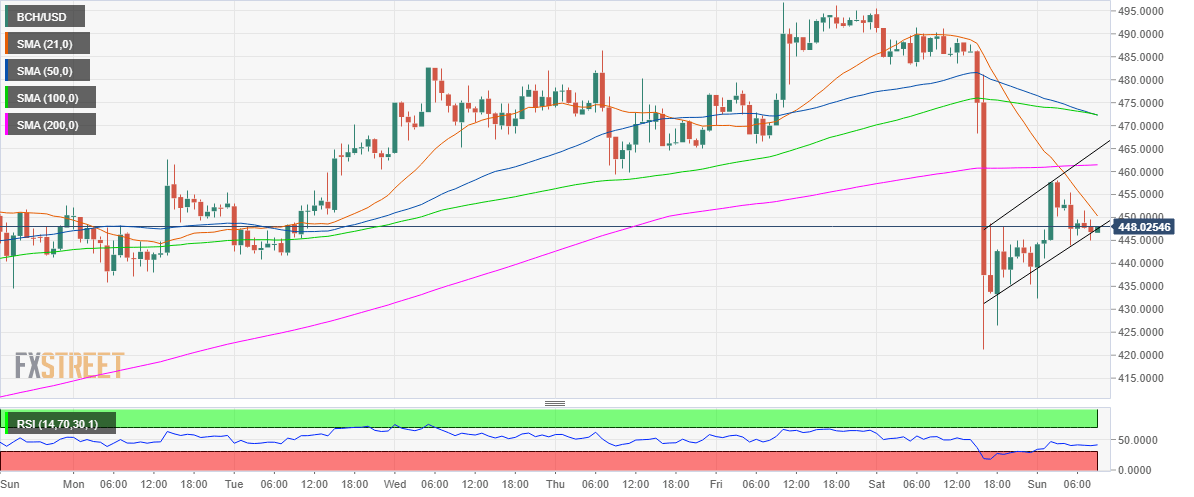
No. 5 coin is teasing a bearish flag breakdown on hourly sticks, with the hourly Relative Strength Index (RSI) flattening below the mid-line.
An hourly close below the rising trendline support at 446.58 is needed to confirm the bearish continuation pattern.
Bears would target Saturday’s low of 421.30 on a bear flag breakdown.
On the flip side, the bulls need to regain the bearish 21-hourly Simple Moving Average (HMA), in order to revive the recovery momentum.
The next resistance awaits at the horizontal 200-HMA of 461.40, above which the rising trendline resistance will be tested at 463.80.
BCH/USD levels to watch
