- Bitcoin Cash price recovered from trading below $500 support, but the bullish trend came to a halt short of $530.
- Outlook of the BCH/USD chart is positive, but a couple of resistance lines will limit gains at $518.72 and at $530 before facing the critical $550 level.
In the past couple of days, investor witnessed Bitcoin Cash violating support areas to the extent of trading below $500. In fact, BCH/USD formed a path heading to $470, but fortunately found a stop at $472 before bouncing back up. The trading yesterday saw a brief recovery amid the bear pressure above $480 as well as $490 resistance lines. It broke above the 23.6% Fib retracement level with the last swing high of $534.67 and a swing low of $469.12.
Significantly, the price broke out of the short-term contracting triangle resistance at $492.51 on the 15-minutes chart. The price retraced steps above $500 and $520 resistances but encountered acute bear pressure short of $530. BCH/USD is currently changing hands at $513 while forming a support at the 61.8% Fib retracement level from the last high of $534.67 and a low of $469.12 at $510.
The initial resistance is at the 21-day simple moving average on the 15′ timeframe chart at $518.72. More resistance will be encountered at $530 while the acute resistance on the day is at the $550. Buyers must brace themselves to break the resistance between $518.72 and $530. A break from this resistance range will allow movement towards the critical level at $550.
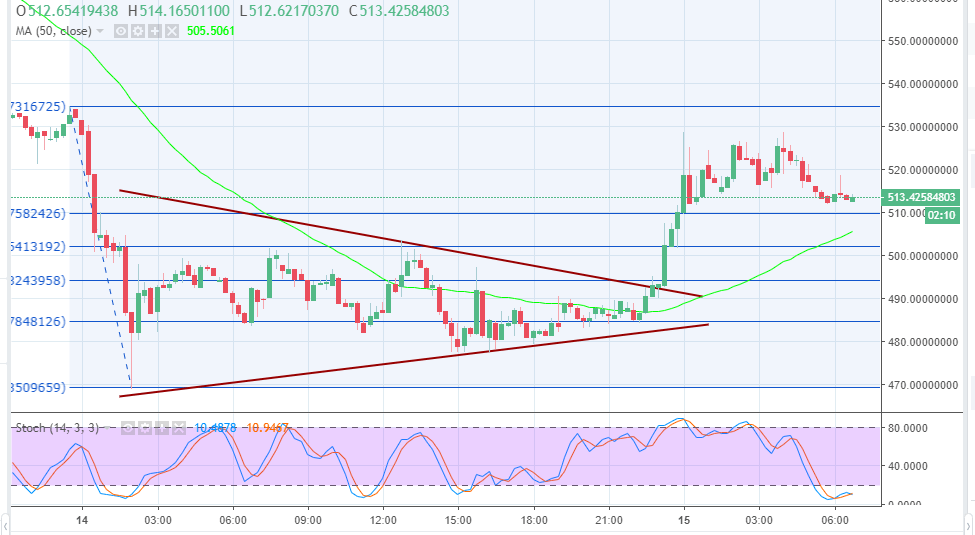
The chart outlook is, however, showing positive signs, besides we see the stochastic advancing slow upwards from the oversold territory.
BCH/USD 15-minutes chart