- Bitcoin Cash price has formed a potential inverse head and shoulders pattern.
- Only one key resistance level separates the digital asset from a 20% breakout.
- Bulls have the upper hand in the short-term after establishing a 4-hour uptrend.
Bitcoin Cash price has been trading below a key resistance level but remains bullish in the short-term. Now, BCH aims for more after establishing a key pattern on the 4-hour chart.
Bitcoin Cash price has to crack this key resistance point
On the 4-hour chart, BCH has formed a potential inverse head and shoulders pattern with its neckline at $545. A clear breakout above this key point would drive Bitcoin Cash price by 20% towards a high of $660.
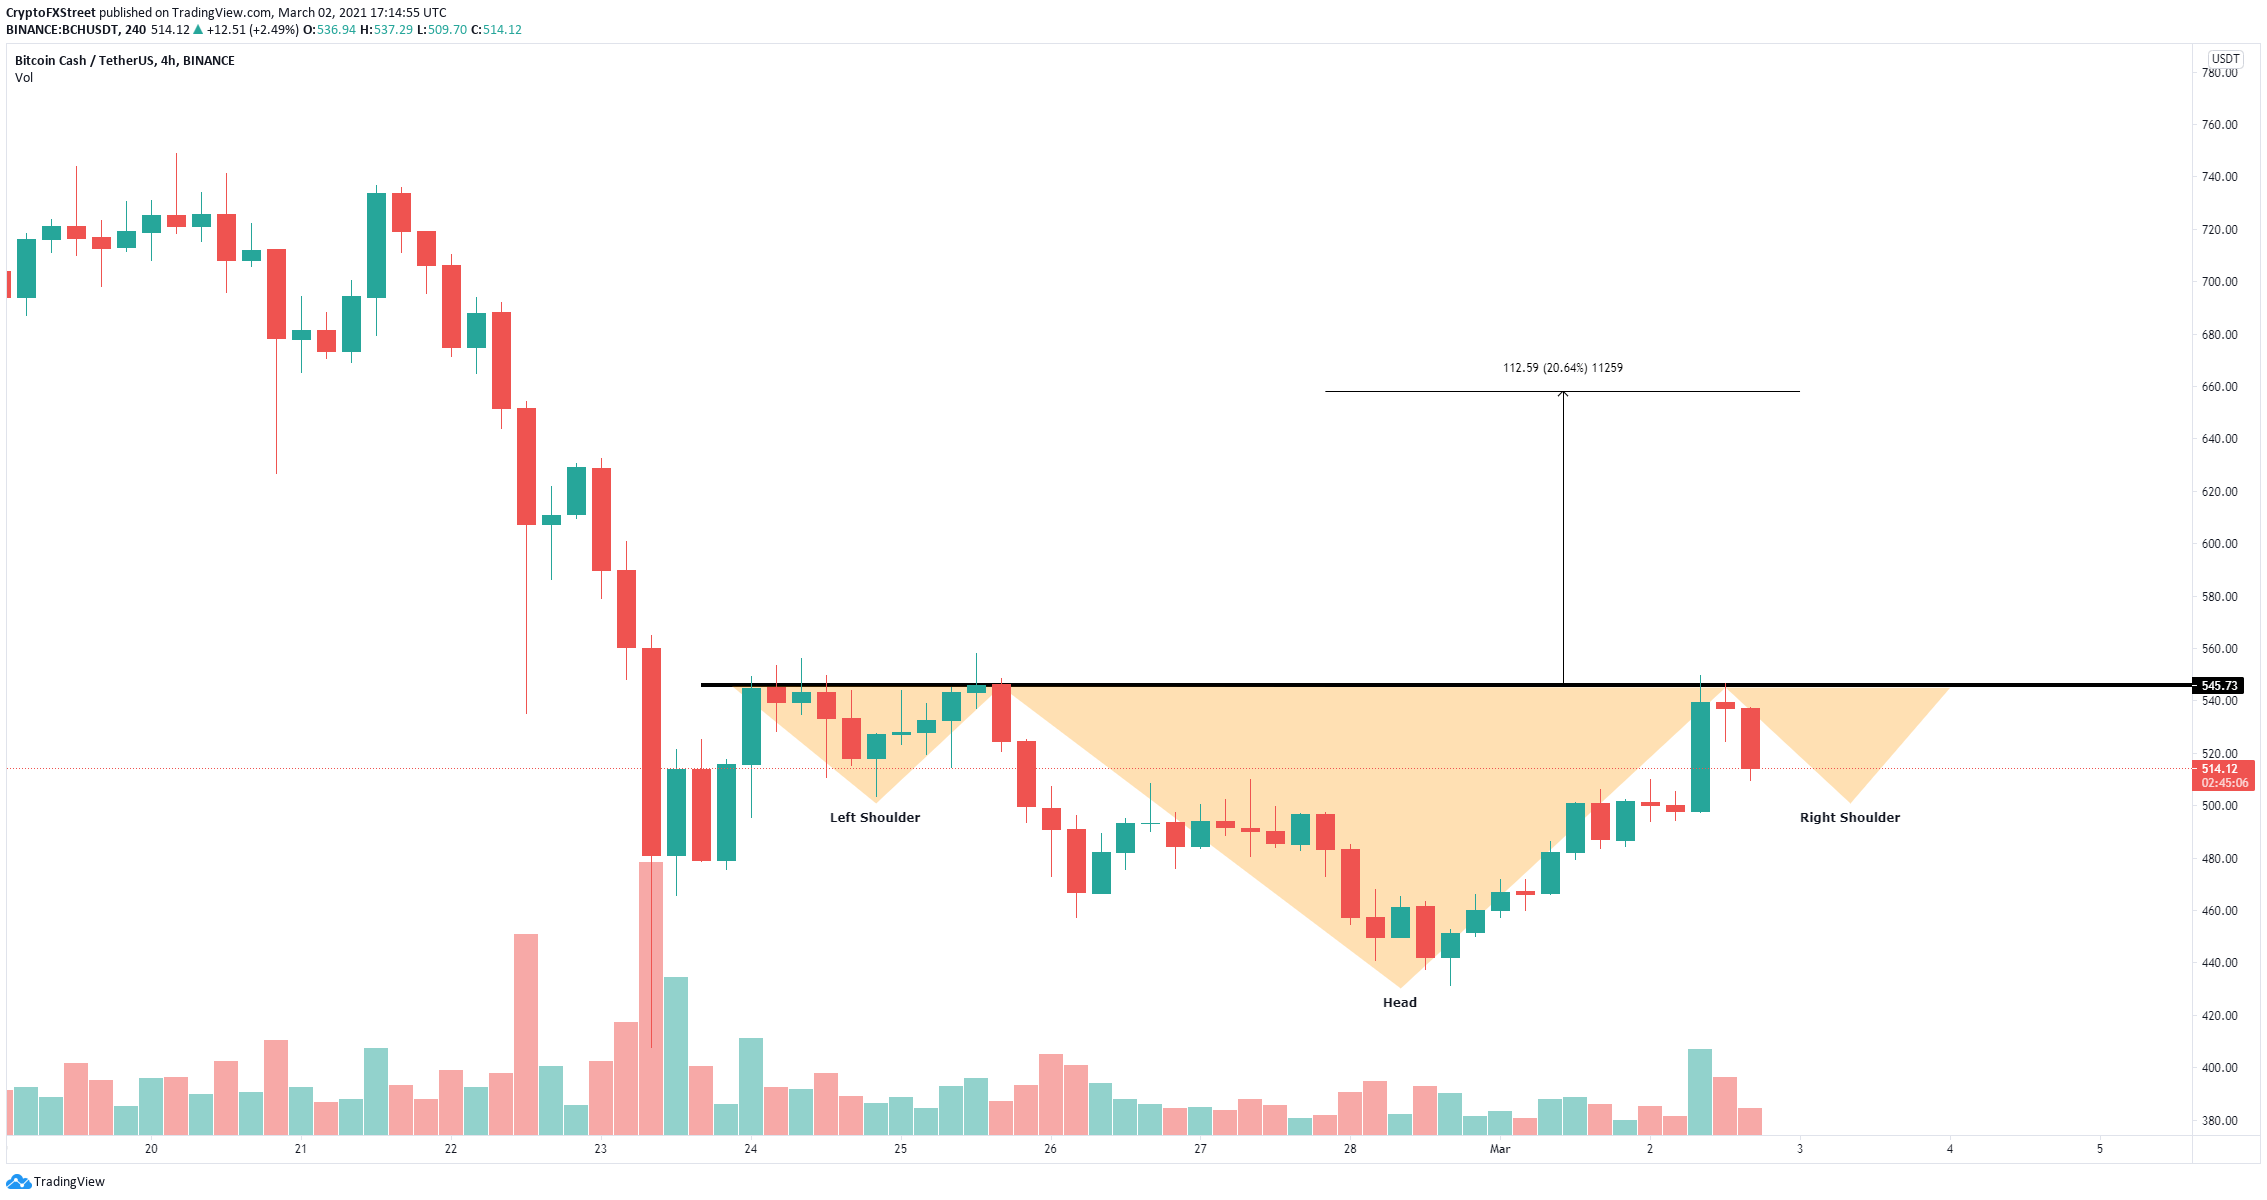
BCH/USD 4-hour chart
According to the In/Out of the Money Around Price (IOMAP) chart, there is practically no resistance. The most significant barrier is located between $528 and $544, coinciding with the neckline of the pattern above.
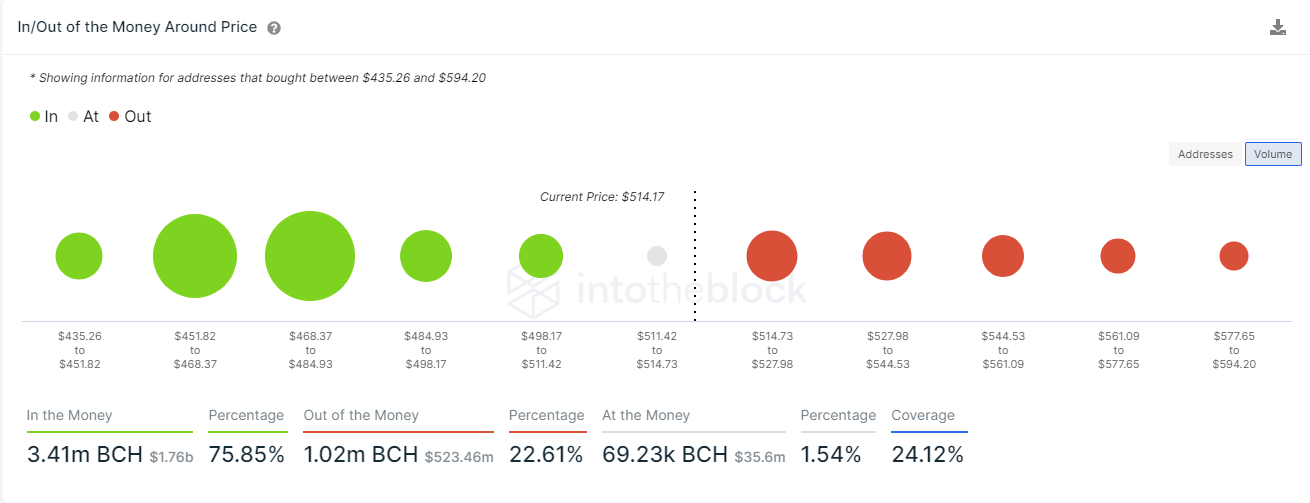
BCH IOMAP chart
On the other hand, although BCH does have strong support on the way down, a breakdown below the key area between $468 and $484 would drive the digital asset down towards $435, and would invalidate the inverse head and shoulders pattern.
