- Bitcoin Cash price is trading in the red, with losses of 5.45% in the second half of the session.
- BCH/USD bulls failed to break down critical supply at the range of $275-280.
- The next major area of support should now be noted at the psychological $200 mark.
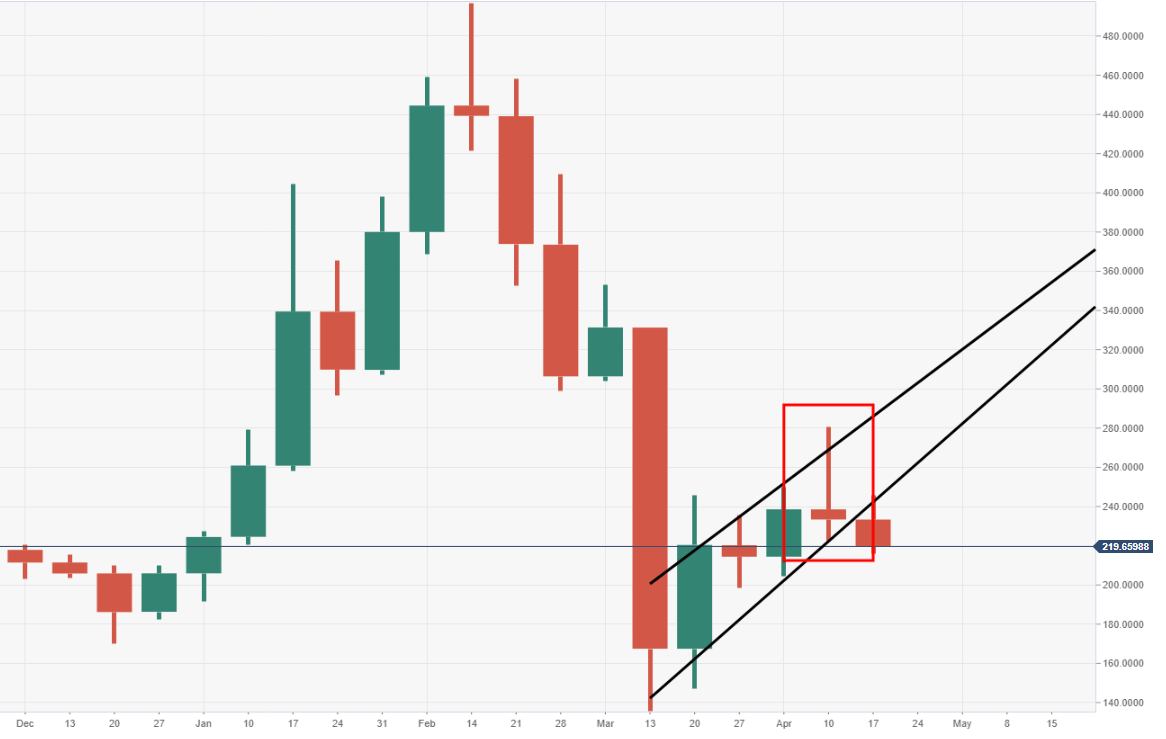
BCH/USD weekly chart
A deadly evening star formation can be observed via the weekly chart view, suggesting a change in trend.
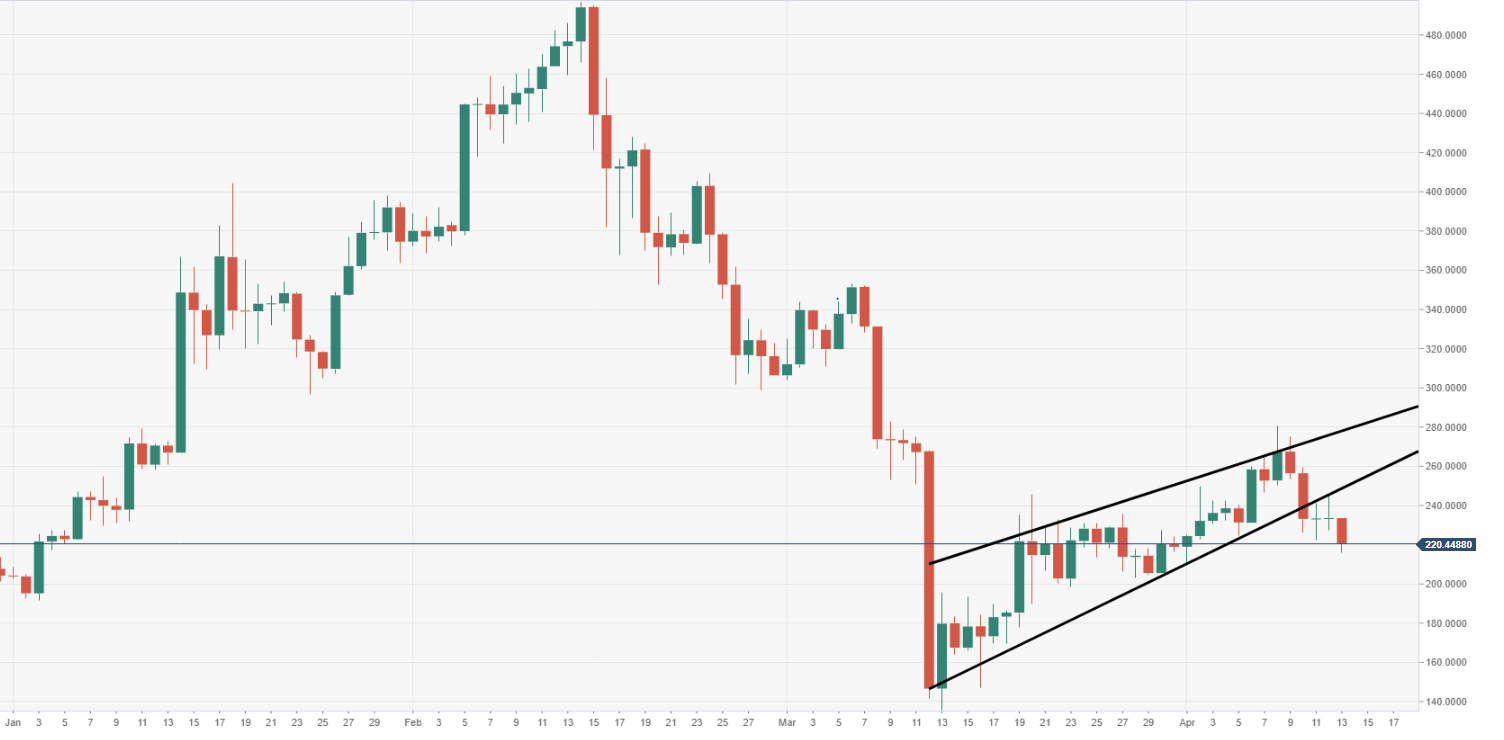
BCH/USD daily chart
The price has broken out to the downside from a bearish flag structure, leaving the door open to greater moves south.
Spot rate: 220.97
Relative change: -5.45%
High: 233.56
Low: 215.94
