- Bitcoin Cash price has seen a massive explosion in the past week jumping from a low of $333 to $464.
- The digital asset faces one last resistance level before $500.
Bitcoin Cash has been inside a steady and robust uptrend since September 2020. In total, the digital asset has risen by more than 130% but hasn’t yet beaten the 2020-high of $498 established on February.
Bitcoin Cash faces one critical resistance level
BCH is currently trading at around $440 after significant continuation in the past 24 hours from an initial breakout above $360 on January 3. The digital asset now faces very little resistance ahead according to various indicators.
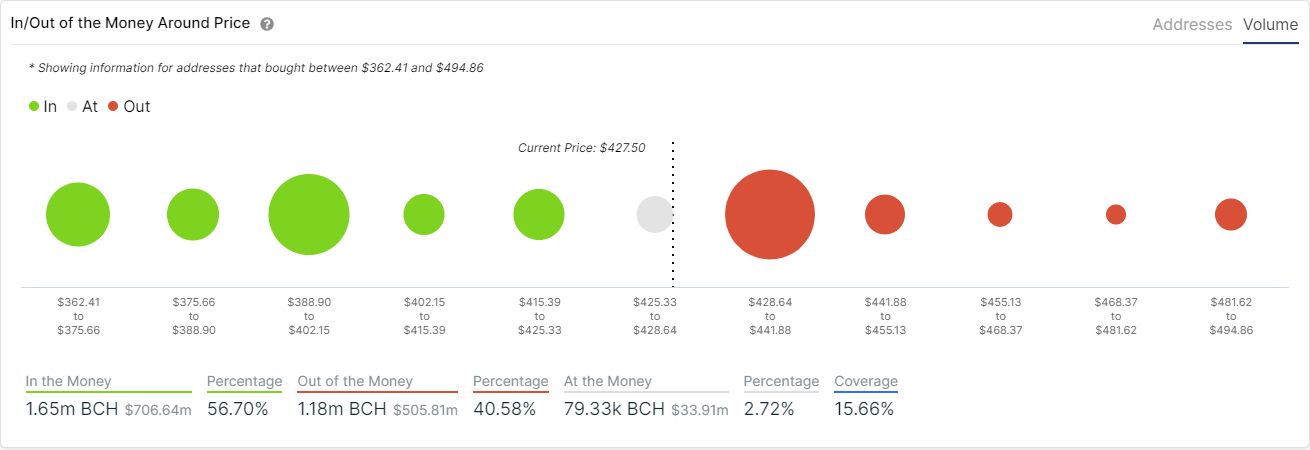
BCH IOMAP chart
According to the In/Out of the Money Around Price (IOMAP) chart, Bitcoin Cash has established a strong resistance area between $428 and $441. A breakout above this range can quickly push Bitcoin Cash price towards $500.
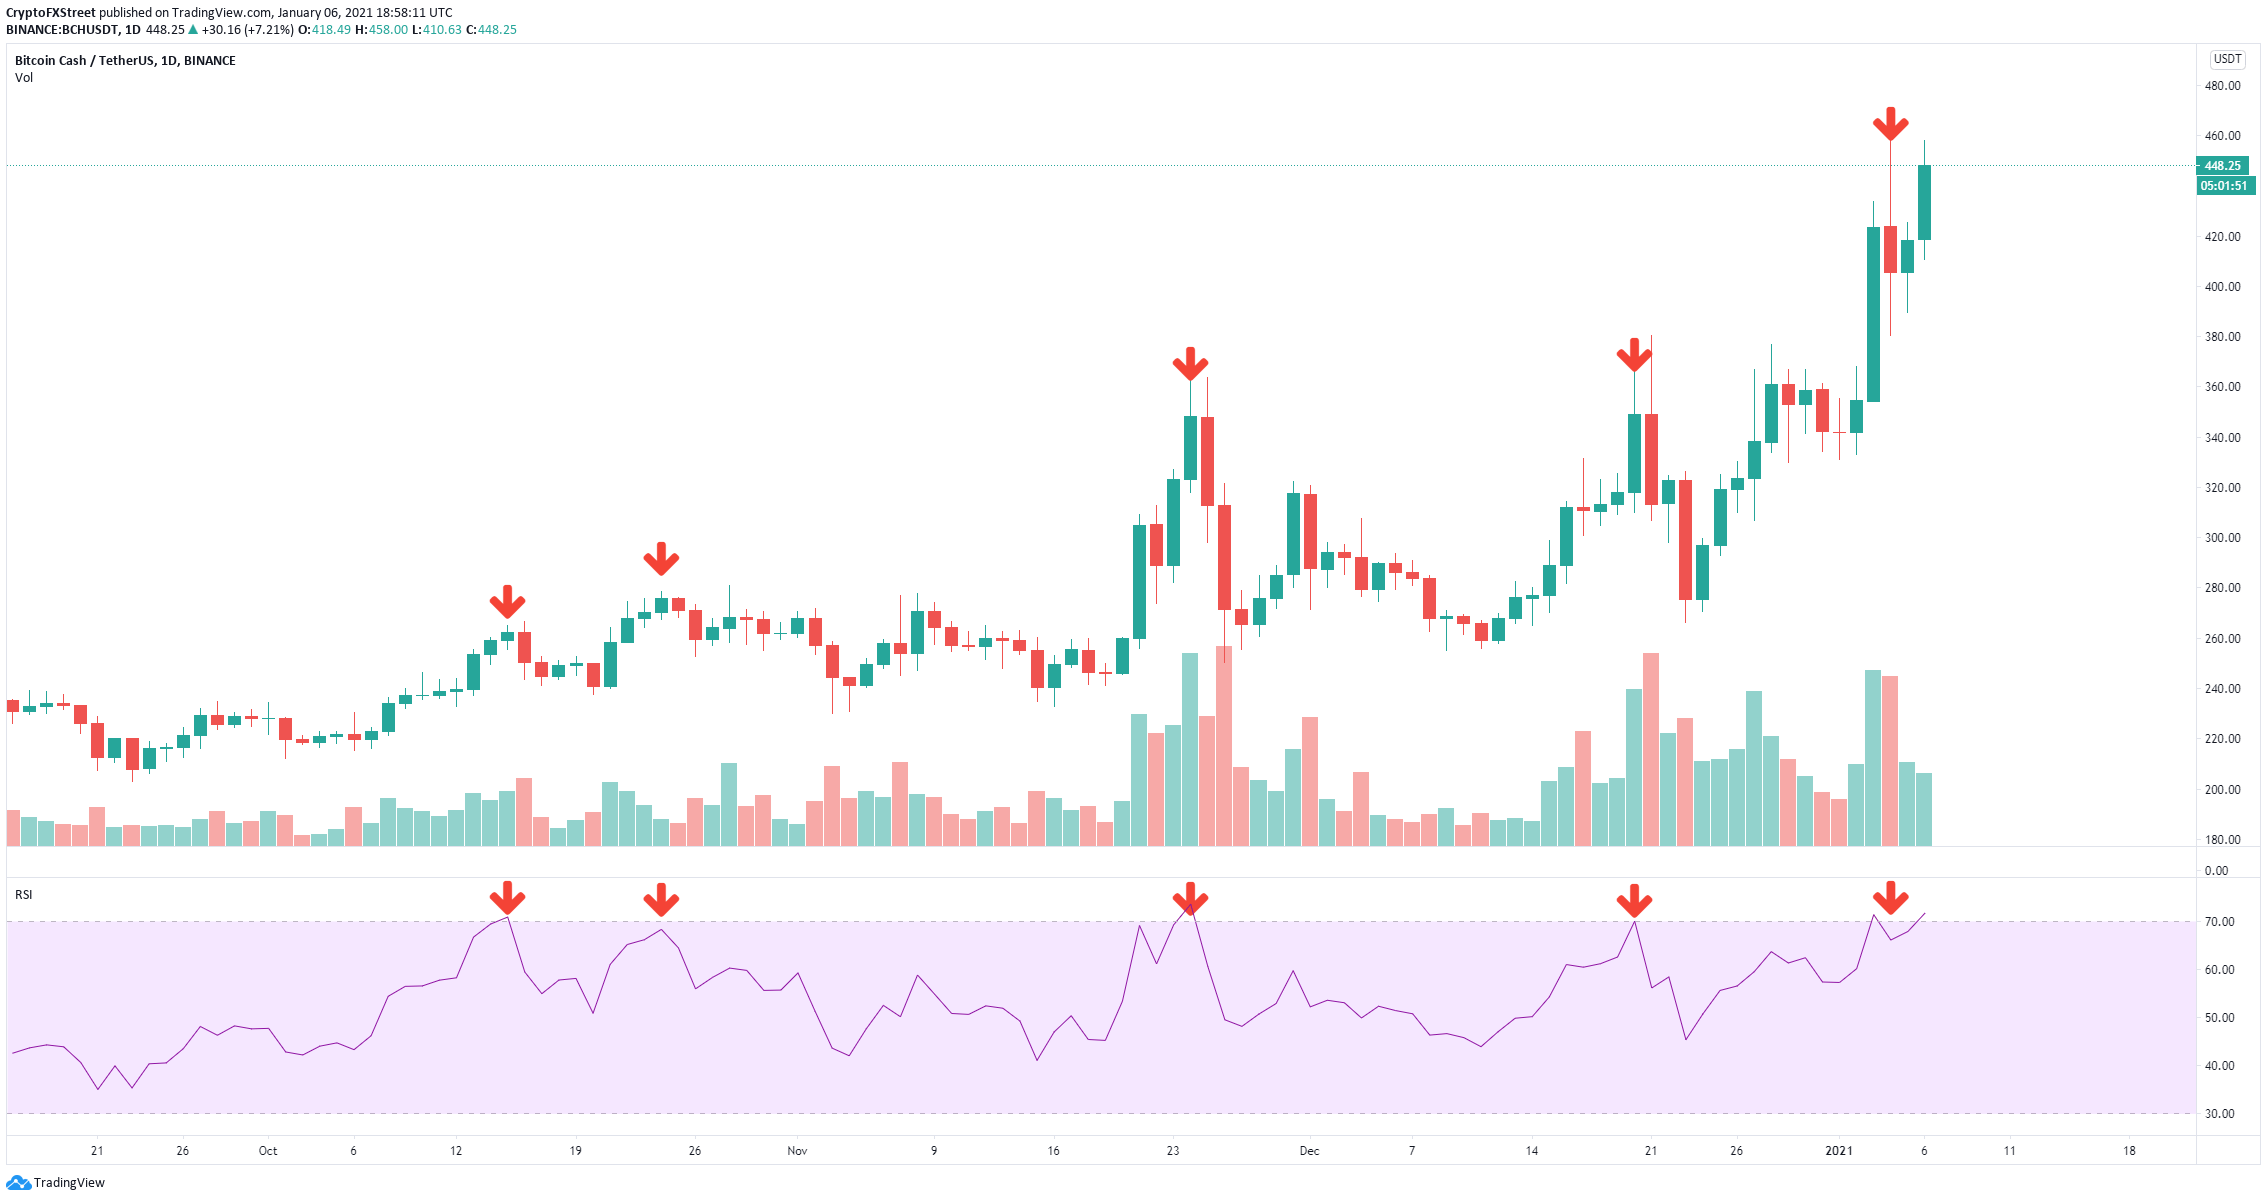
BCH/USD daily chart
However, on the daily chart, the RSI is overextended, which indicates a pullback is nearby. In the past several months, the overbought RSI has been an accurate indicator of temporary tops for Bitcoin cash.
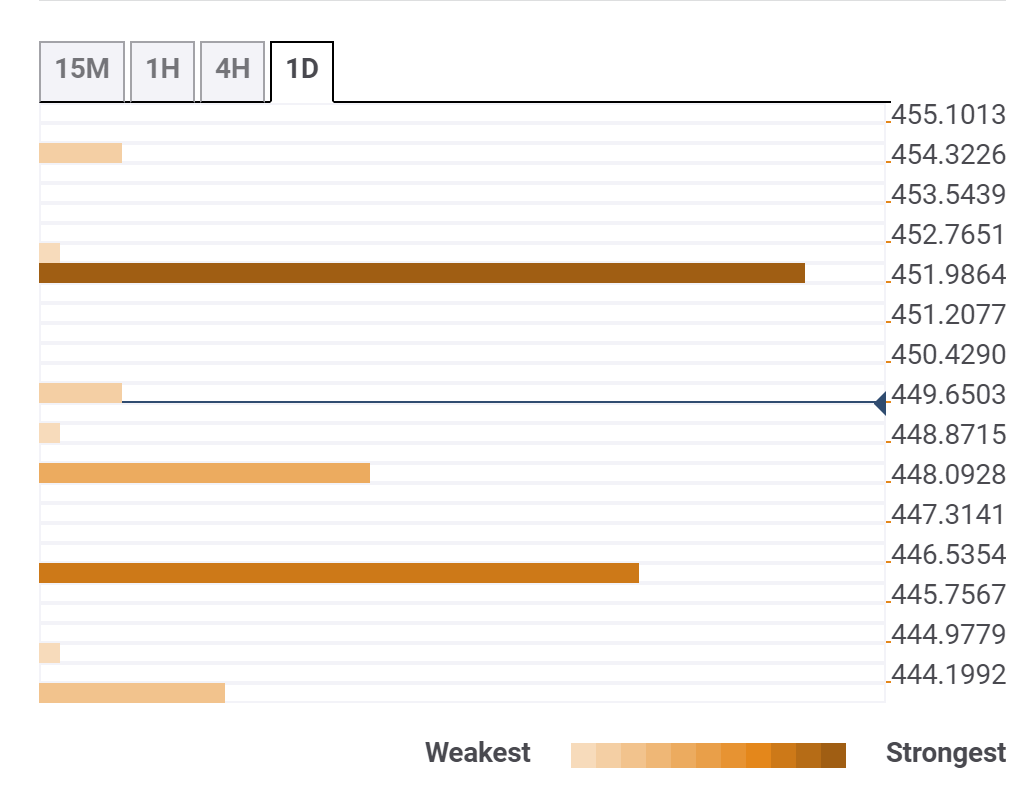
BCH Confluence Levels
The confluence detector shows weak support below at $448 which is the Pivot Point on the daily and $445 which coincides with the Pivot Point 1 Week R3 and the previous hourly low.
On the way up, the most significant resistance level seems to be located at $452 where the 10-SMA on the 15-minutes chart is located and the Pivot point 1 Month R2.
