- Bitcoin Cash price had a massive 40% rally from December 23 until December 28.
- The digital asset seems to be poised for a massive correction according to several indicators.
BCH had a significant rally in the past week, outperforming several coins. The digital asset now seems poised for a pullback which should be considered healthy, but imminent. Various indicators suggest it will happen soon.
Bitcoin Cash price prepares for a pullback down to $300
On the 15-minutes chart the TD Sequential indicator has just presented a sell signal, similarly, on the 30-minutes chart, the indicator is on the verge of printing the same call within the next 30 minutes.
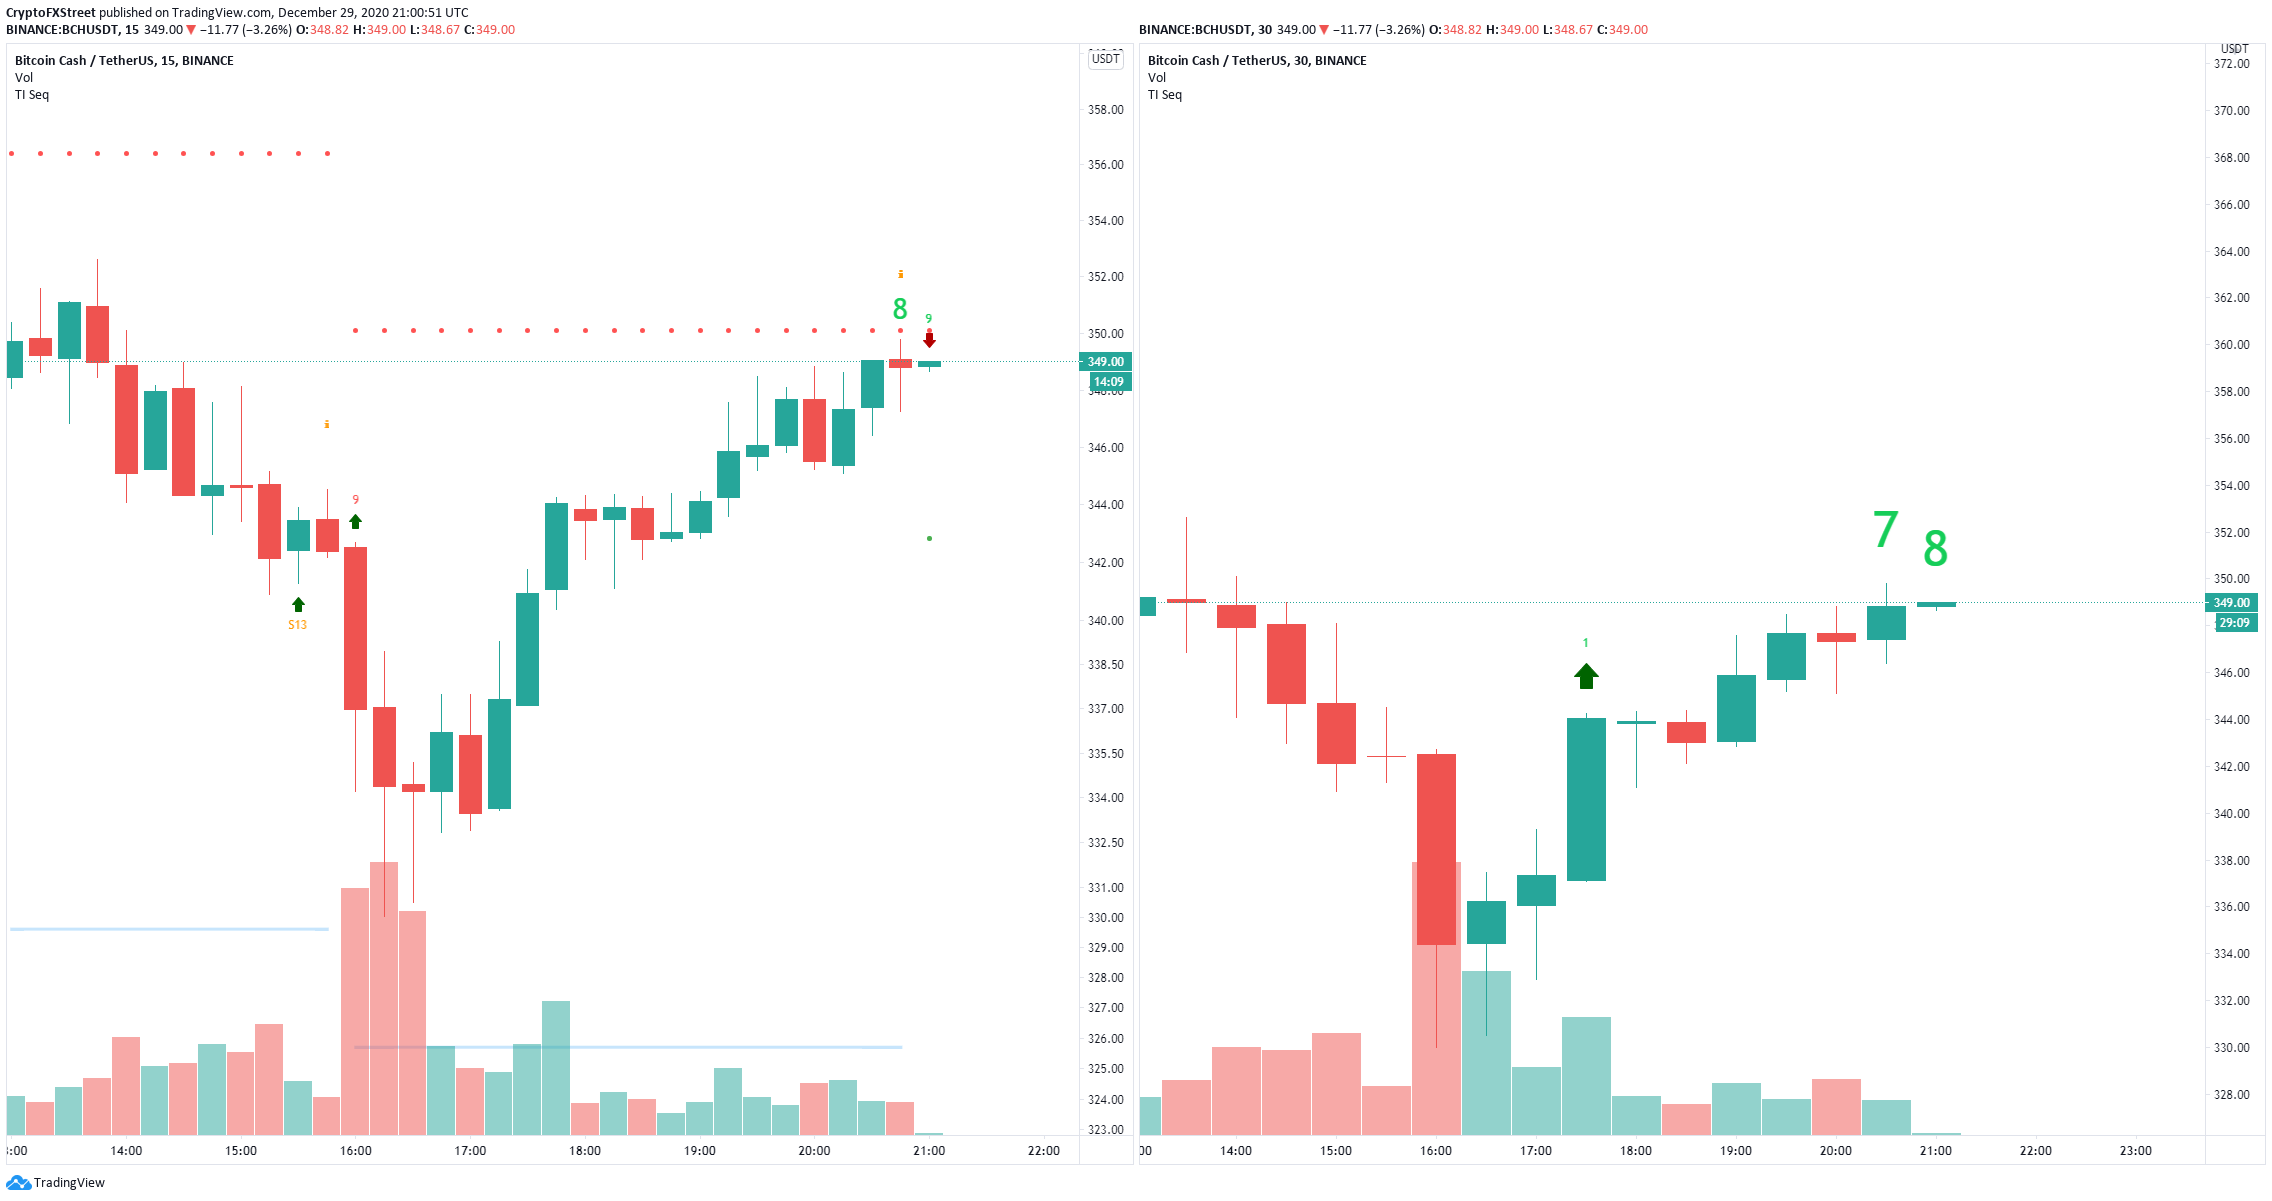
BCH/USD 15-minutes and 30-minutes charts
Furthermore, the TD Sequential indicator also presented a significant sell signal on the 12-hour chart which seems to be getting some continuation. The In/Out of the Money Around Price (IOMAP) chart shows a strong resistance level at $354.
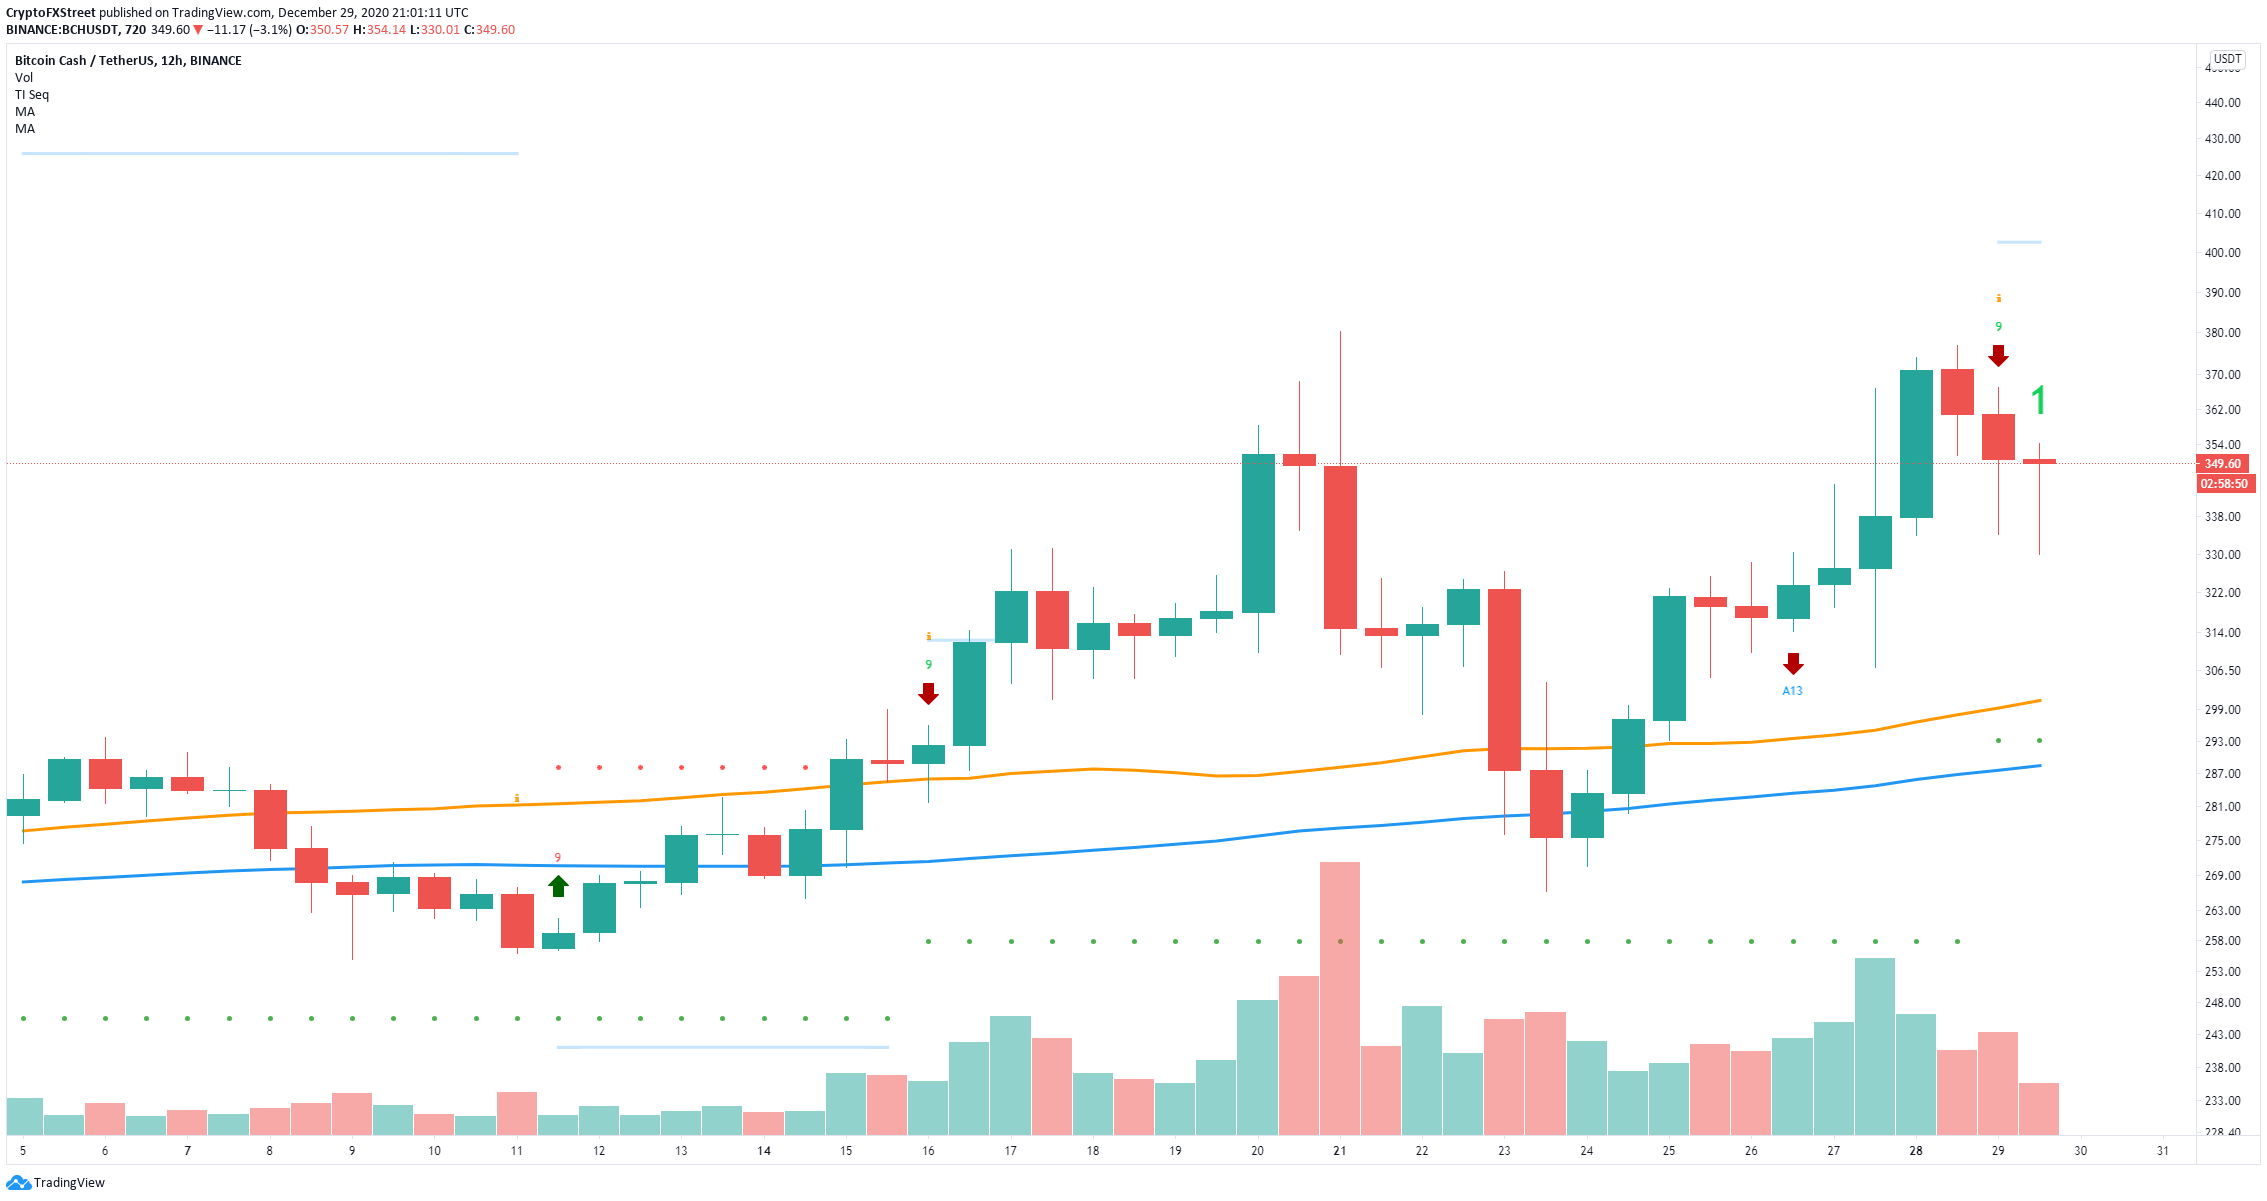
BCH/USD 12-hour chart
According to the IOMAP chart, the most critical support area is located between $325 and $335. A breakdown below this range can quickly push BCH price down to $300. Let’s take a look at the confluence detector to find out significant levels.
-637448732539628511.png)
BCH IOMAP chart
It seems that on the way down there is only one significant support area between $345 and $344 which coincides with several SMAs and the previous hourly low and the Middle Bollinger Band on the 4-hour chart.
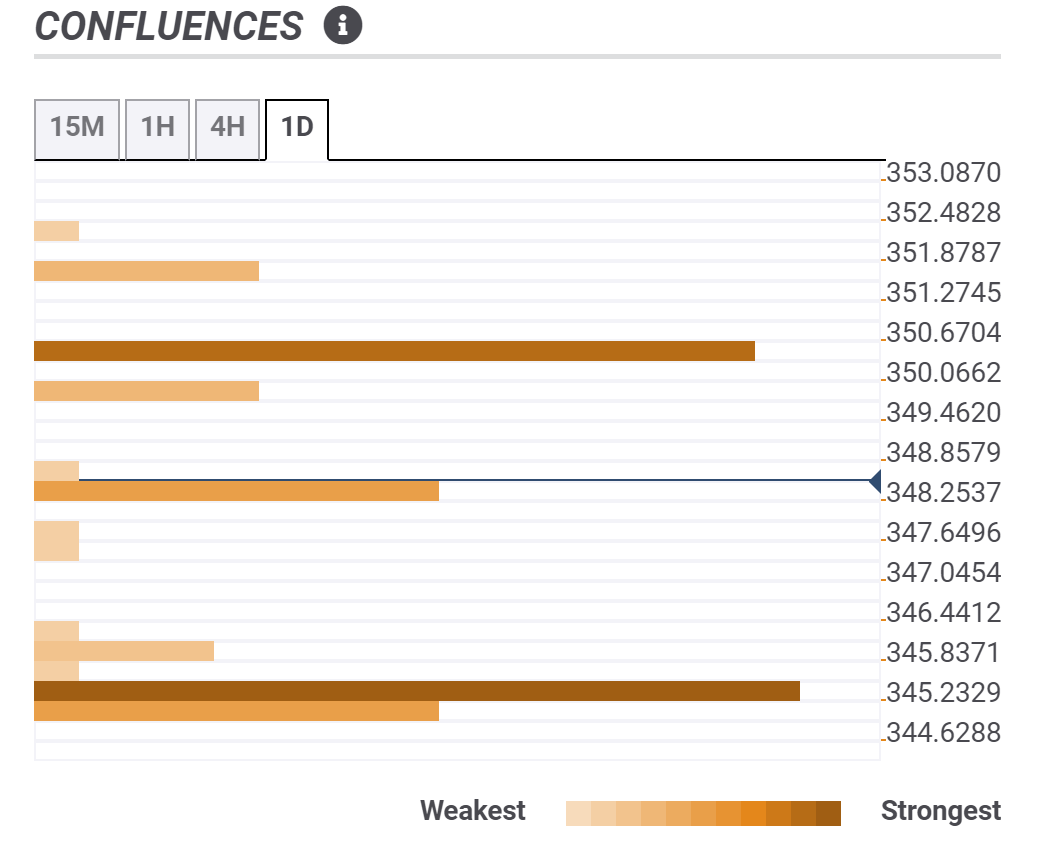
BCH Confluence Levels
When it comes to resistance above, the level at $350 seems to be the most critical point as it coincides with the previous hourly and 15-minutes highs and the Fib 61.8% level on the daily chart.
