- Bitcoin Cash price is trading in the red, with losses of 2.50% in the second half of the session.
- BCH/USD remains vulnerable trading underneath the breached psychological $200 mark.
- The next major area of support is seen down at the $150 price territory.
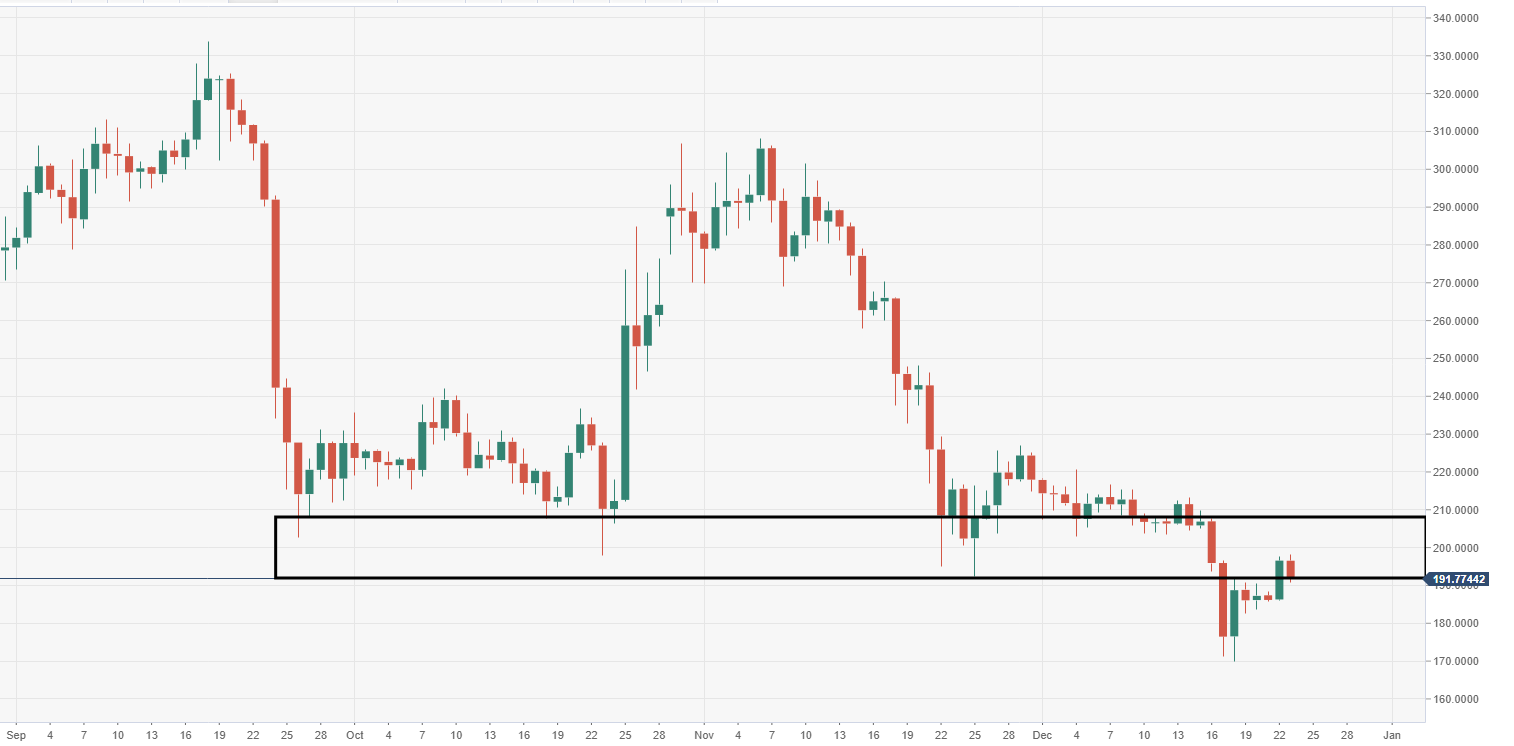
BCH/USD daily chart
Heavy supply can be observed from $190-210 price range, following the breach last week.
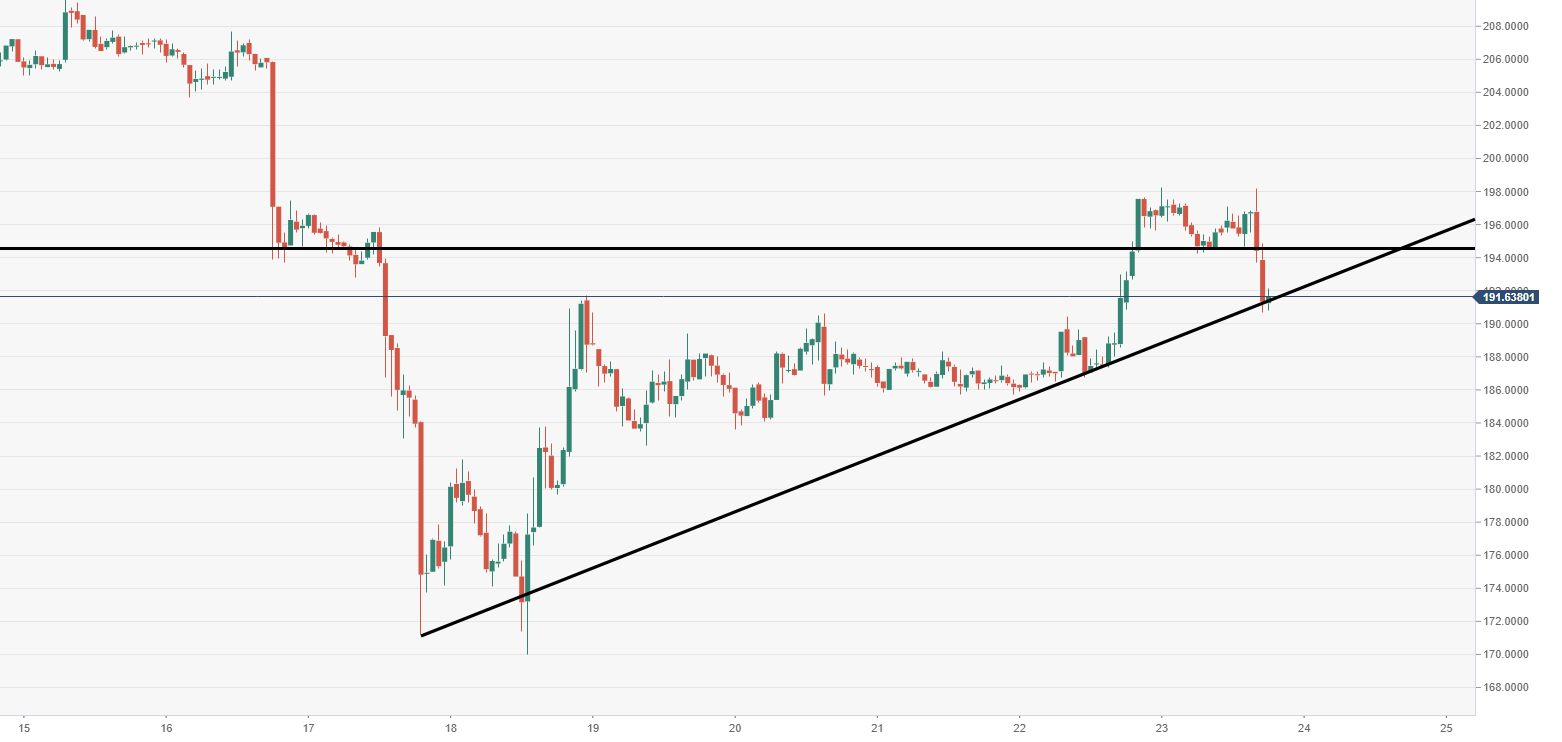
BCH/USD 60-minute chart
The price is sitting on a critical near-term ascending trend line of support via the 60-minute view.
Spot rate: 181.97
Relative change: -3.40%
High: 198.27
Low: 190.68
