- Bitcoin Cash price in the session on Wednesday is trading in negative territory by some 2.15%.
- BCH/USD price action has been recovering over the last four weeks, following the strong selling form June-July period.
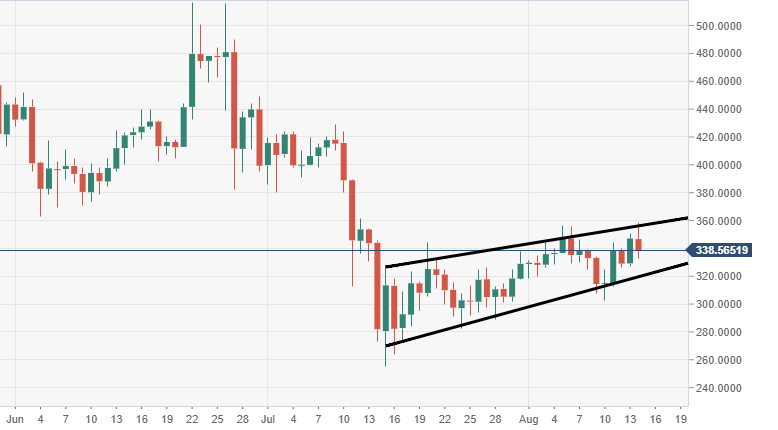
- During the noted period of recovery, price action via the daily has formed a bearish flag structure.
Spot rate: 338.65
Relative change: -2.45%
High: 358.49
Low: 333.04
BCH/USD daily chart
- Price action via the daily chart view is moving within a bearish flag structure, subject to a potential breakout south.
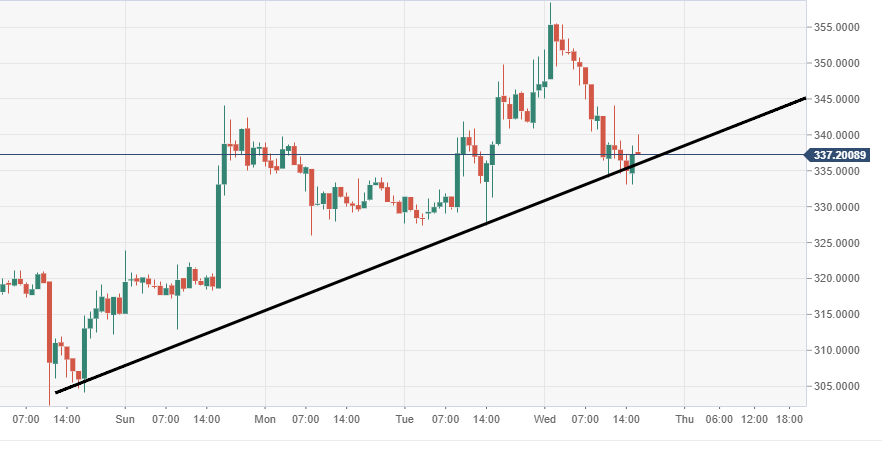
BCH/USD 60-minute chart
- Price action is being supported to the upside by an ascending trend line via the 60-minute chart view.