- Bitcoin Cash price is seen nursing steep losses of some 5% in the latter part of Monday’s session
- BCH/USD price breached a key daily ascending trend line of support, seeing a further wave of pressure continue south.
BCH/USD 15-minute chart
- The price is moving within a narrowing range formation, making up a bearish flag pattern.
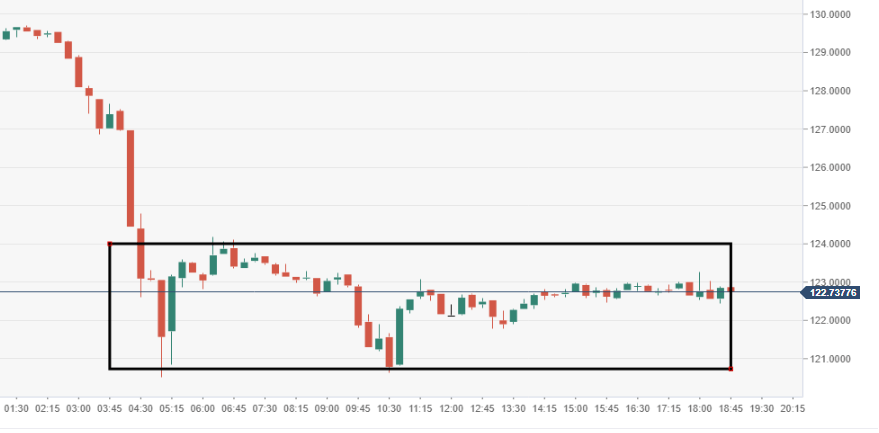
Spot rate: 122.85
Relative change: -5.02%
High: 129.70
Low: 120.52
Trend: Bearish
Trends:
Daily SMA20: 131.4992
Daily SMA50: 126.2192
Daily SMA100: 138.5064
Daily SMA200: 315.1472
Levels:
Previous Daily High: 131.0717
Previous Daily Low: 128.0378
Previous Weekly High: 156.9334
Previous Weekly Low: 125.1897
Previous Monthly High: 156.9334
Previous Monthly Low: 109.9144
Daily Fibonacci 38.2%: 129.1967
Daily Fibonacci 61.8%: 129.9127
Daily Pivot Point S1: 127.5553
Daily Pivot Point S2: 126.2796
Daily Pivot Point S3: 124.5214
Daily Pivot Point R1: 130.5893
Daily Pivot Point R2: 132.3475
Daily Pivot Point R3: 133.6233
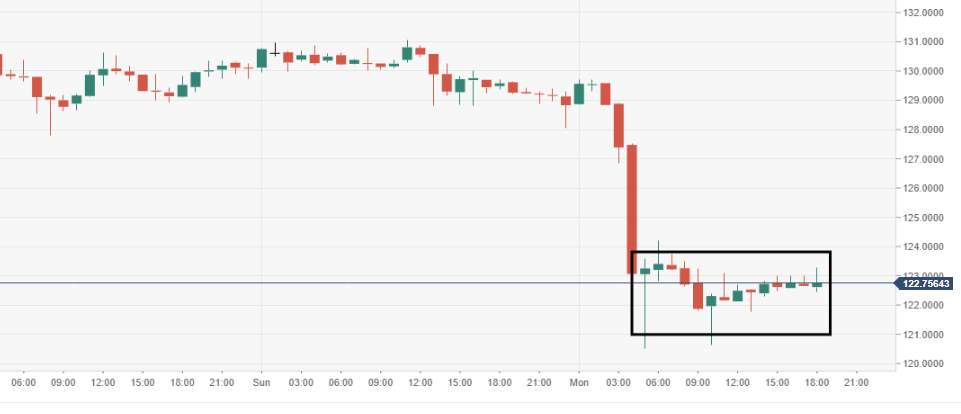
BCH/USD 60-minute chart
- Price action is moving within a near-term bearish flag formation via the 60-minute, subject to further potential downside.
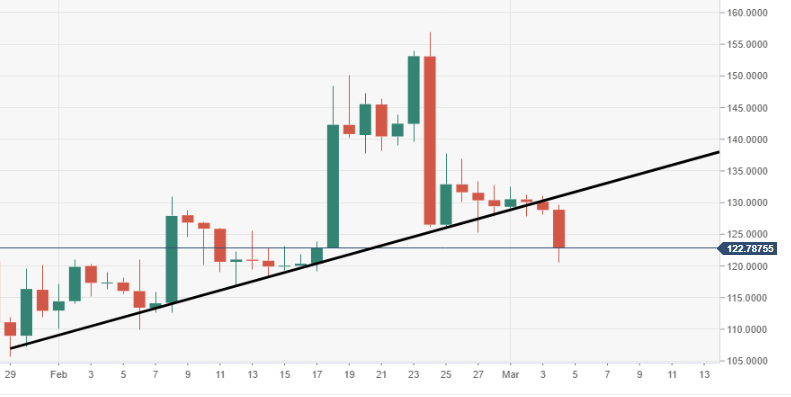
BCH/USD daily chart
- A key trend line break was seen via the daily, further downside pressure flowing.