- The Bitcoin Cash price was seen nursing losses of over 2.5% in the session on Thursday, after the price failed again to sustain the $900 mark.
- Supply zone has proven to be heavy between $905-915, as seen over the past few sessions.
BCH/USD 60-minute chart
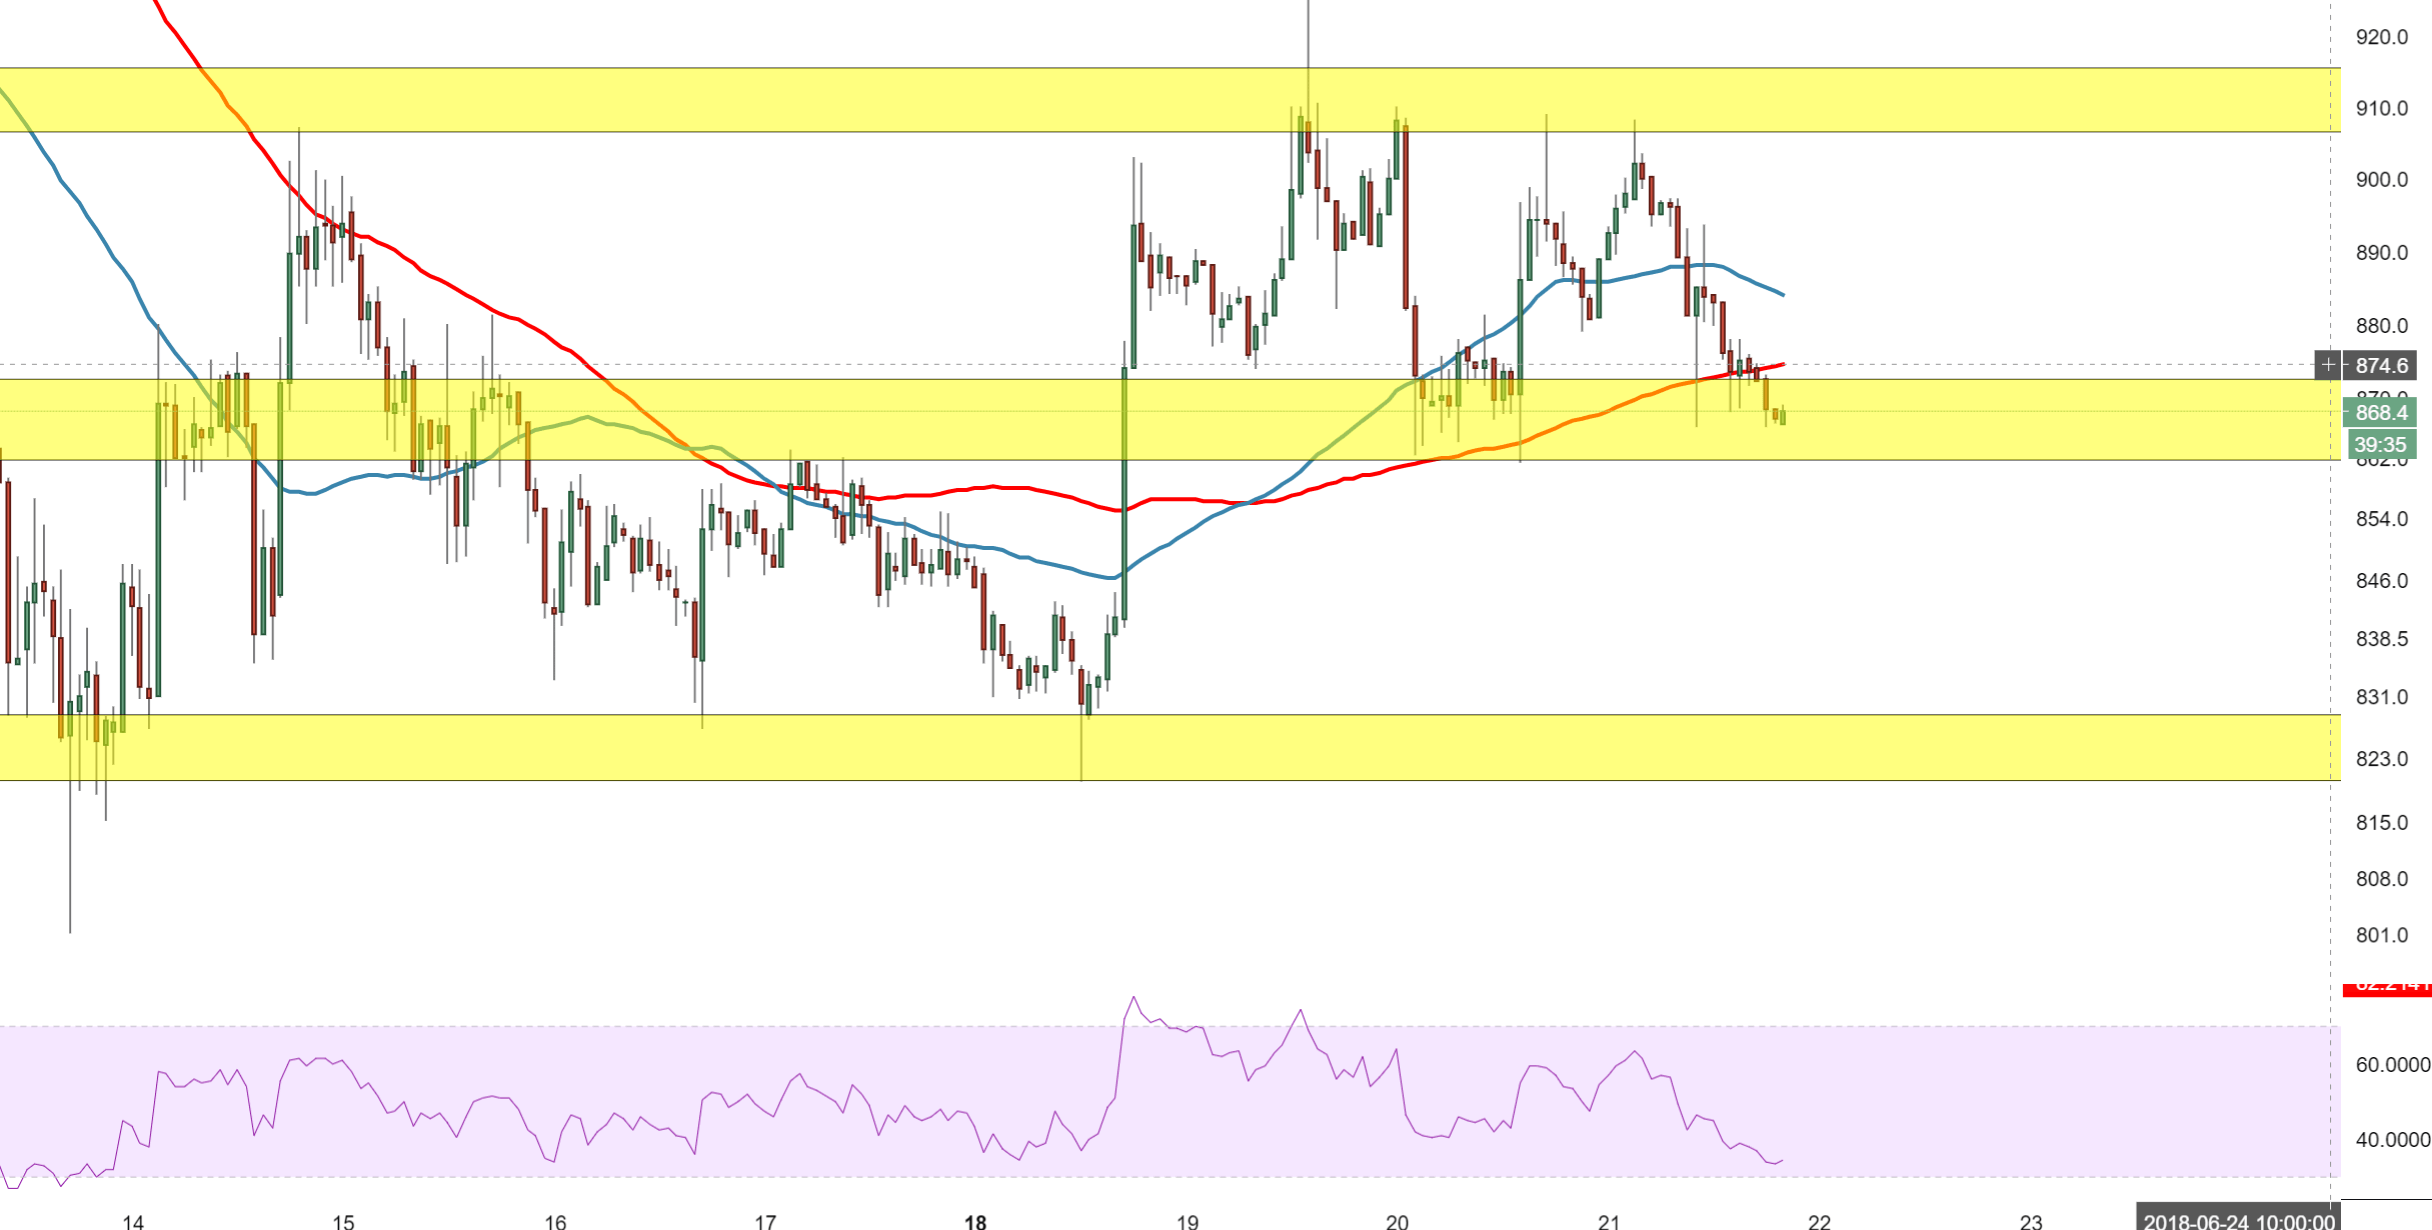
Spot rate: 867.1
Relative change: -2.85%
High: 908.2
Low: 866.1
Trend: Bearish
Support 1: 861.0, bottom of demand zone.
Support 2: 830.5, (support on 60-minute chart) & demand zone.
Support 3: 801.6, 13th June low.
Resistance 1: 874.7, 100MA.
Resistance 2: 883.70, 50MA.
Resistance 3: 906.70, demand zone entry.
