BCH/USD daily chart
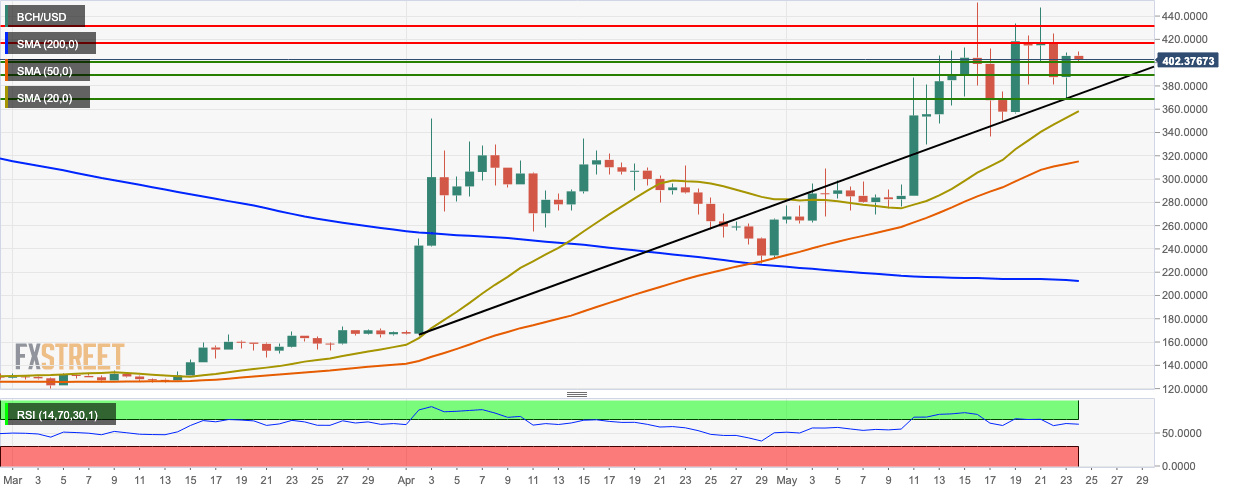
- BCH/USD went down from $406.30 to $402.50 in the early hours of Friday.
- Critical support line lies at $400, which the bulls must defend at all costs.
- The market remains above the 2000-day simple moving average (SMA 200), SMA 50 and SMA 20 curves.
- The relative strength index (RSI) indicator is trending at 65.60.
BCH/USD 4-hour chart
-636942652937086330.png)
- The five latest sessions in the 4-hour price chart have taken the price from below the 20-day Bollinger band to the middle.
- The 4-hour market finds resistance at the SMA 20 curve.
- The market is trending above the SMA 50 and SMA 200 curves.
- The moving average convergence divergence (MACD) indicator shows decreasing bearish momentum as the signal line converges with the MACD line.
BCH/USD hourly chart
-636942652455355396.png)
- The hourly market found resistance $407.75
- The Ichimoku indicator hints that upcoming market sentiment may be bullish.
- The bulls need to garner enough momentum to breach the critical $407.75 resistance level.
- Six out of the seven latest sessions in the Elliot oscillator is bullish.
Key levels
