- Bitcoin Cash price nursing losses of some 0.50% in the second half of trading on Thursday.
- BCH/USD price action is moving within a bearish flag pattern formation, subject to potential breakout south.
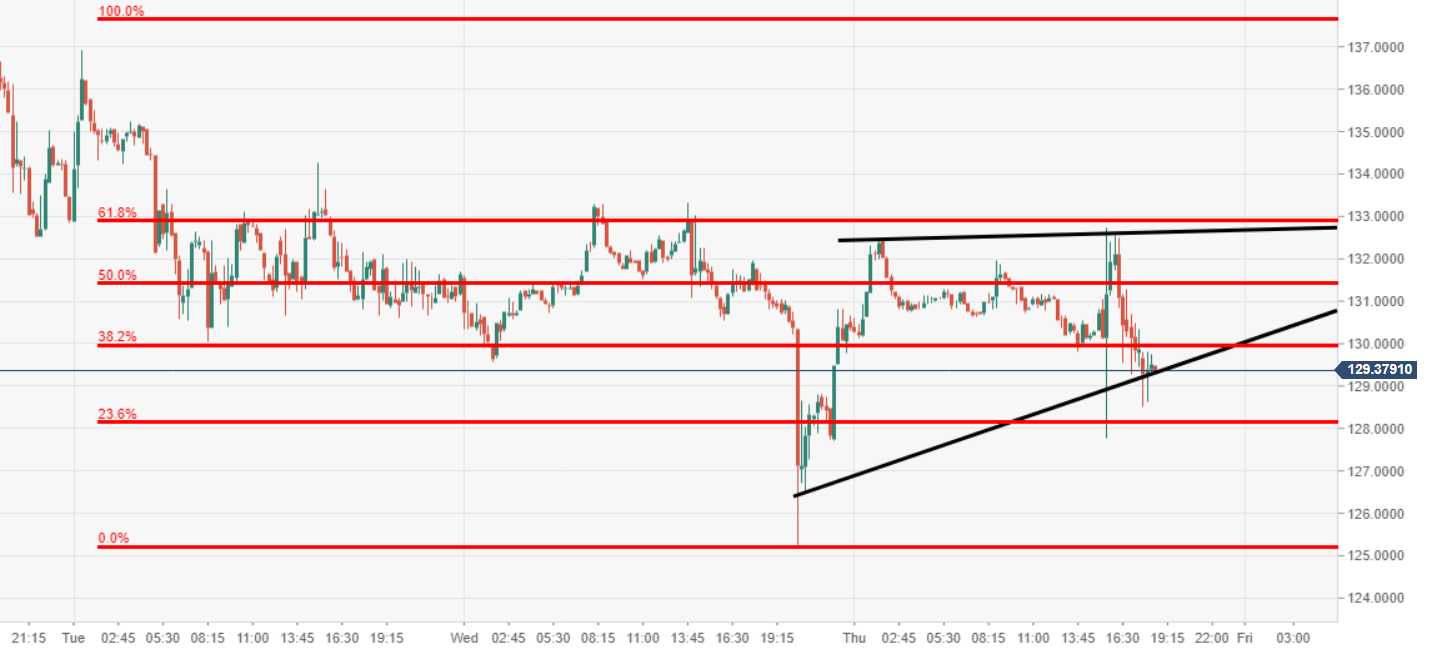
BCH/USD 15-minute chart
- Additional selling pressure as the price headed through the 38.2% Fibonacci. Moving within a rising wedge formation, additional confluence to further potential downside, if a breakout is observed.
Spot rate: 129.40
Relative change: -0.50%
High: 132.71
Low: 127.77
Trend: Neutral/Bearish
Trends:
Daily SMA20: 130.6186
Daily SMA50: 128.0663
Daily SMA100: 145.2476
Daily SMA200: 324.1113
Levels:
Previous Daily High: 133.3203
Previous Daily Low: 125.1897
Previous Weekly High: 150.0785
Previous Weekly Low: 119.129
Previous Monthly High: 174.9558
Previous Monthly Low: 104.8742
Daily Fibonacci 38.2%: 128.2956
Daily Fibonacci 61.8%: 130.2144
Daily Pivot Point S1: 125.9267
Daily Pivot Point S2: 121.4929
Daily Pivot Point S3: 117.7961
Daily Pivot Point R1: 134.0573
Daily Pivot Point R2: 137.7541
Daily Pivot Point R3: 142.1879
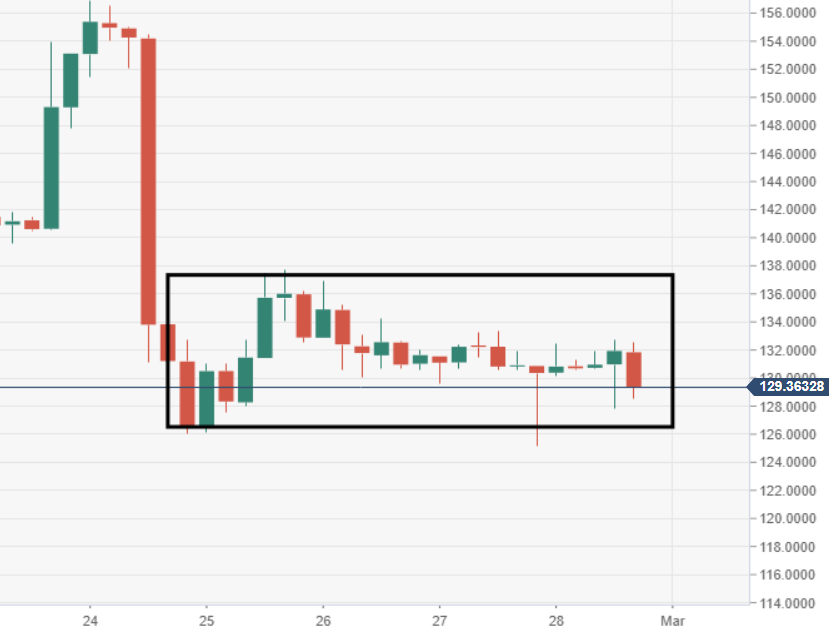
BCH/USD 60-minute chart
- A breakout is anticipated out from this range-block formation observed via the 60-minute view.
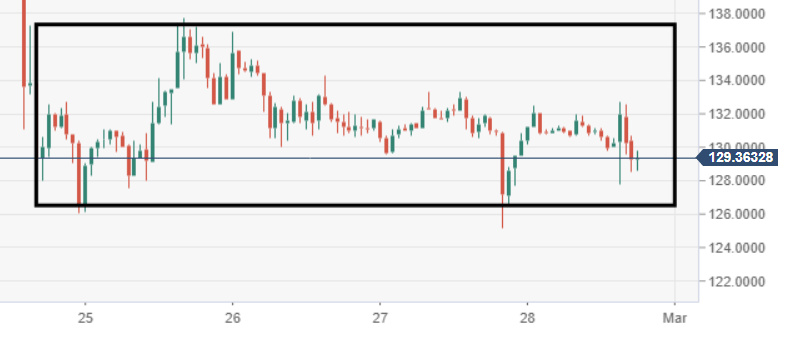
BCH/USD 4-hour chart
- Price action moving within a bearish flag formation, observed via the 4-hour chart view.