- Bitcoin Cash price trading down over 3.0% well into the second part of the session on Tuesday.
- BCH/USD price action moving within a descending wedge pattern, subject to a breakout to the upside.
- Should the 25th November low around $145 continue to hold, buying pressure could be seen right around the corner.
BCH/USD daily chart
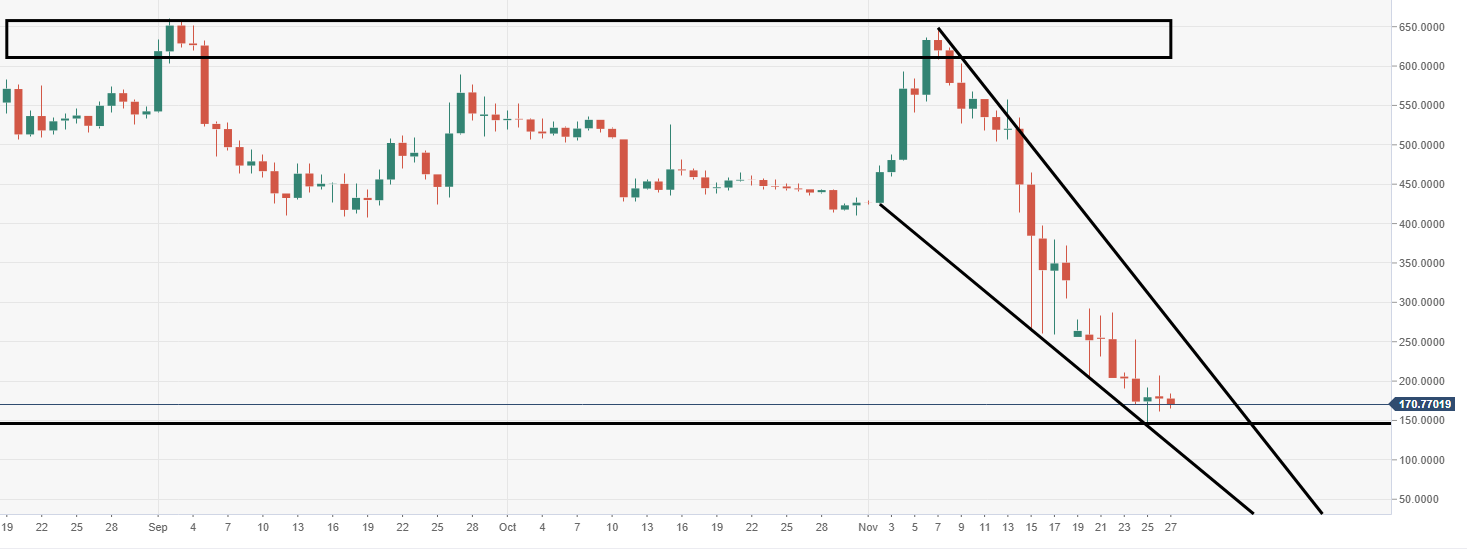
Spot rate: 171.47
Relative change: -3.21%
High: 185.19
Low: 167.27
Trend: Bearish
Support 1: 170.60, daily support.
Support 2: 162.15, 26 November low.
Support 3: 145.09, 25 November low.
Resistance 1: 31.78, breached trend line.
Resistance 2: 34.06, neckline of double bottom.
Resistance 3: 35.94, daily pivot point resistance.
