- BTG/USD technical are strongly positive in the short-term.
- It is only a matter of time before the price steps above $18.00 and correct to $20.00.
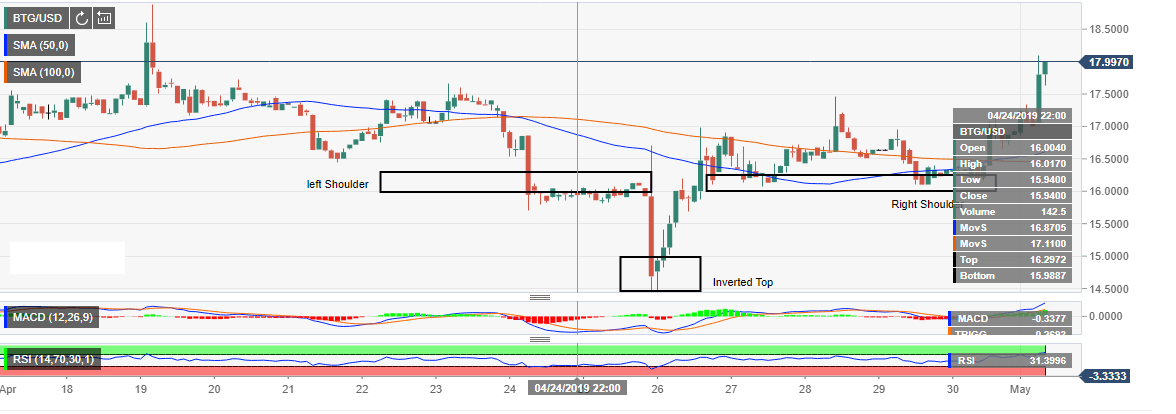
BTG/USD is among the biggest single digit gainers on Wednesday. Intraday charts show a formidable 4% increase in value on the day. Moreover, Bitcoin Gold is trading above both the 50 Simple Moving Average (SMA) and the 100 SMA 2-hour.
The reaction to the completed inverted head-and-shoulders pattern increased the bull’s confidence in the breakout on Tuesday. The price stepped above $17.00 on May 1. The building bullish momentum from the short-term support at $17.00 has formed an engulfing candlestick that has spiked above $17.50 and tested $18.00.
Technicals are strongly positive at press time with the Relative Strength Index (RSI) having entered the overbought zone. It is only a matter of time before the price steps above $18.00. Similarly, the moving average convergence divergence (MACD) is sharply exploring the levels in the positive territory, which means that the trend is largely in the favor of the bulls.
BTG/USD 2-hour chart
Bitcoin Gold Key technical levels
RSI 2-hour: 73.33
MACD 2-hour: +0.2939
50 SMA 1-hour: $16.62
100 SMA 1-hour: $16.48
