- BTC/USD is moving towards the channel resistance.
- The upside movement lacks momentum.
Bitcoin (BTC) has been pretty dull lately. The price of the largest digital assets has barely moved since the beginning of March. Rare attempts to break free from the tight range failed as the market is gripped with indecision. At the time of writing, BTC/USD is changing hands at $3,870, gaining 1% since this time on Tuesday.
Bitcoin’s intraday technical picture
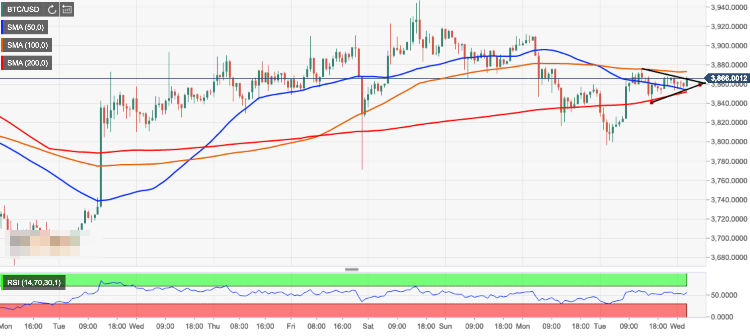
BTC/USD tries to break free from a triangle pattern visible on the 1-hour chart. The price is denting the upper side of the triangle (currently at $3,865), with the next barrier seen at $3,875 (SMA200 1-hour, Tuesday’s high). Apparently, $3,900 is the main barrier that separates the coin from another attempt at $4,000-$4,200 area.
Considering an upward-looking RSI on intraday charts, BTC/USD might continue the upside ahead of European opening; however, a sustainable move towards $4,000 looks less likely at this stage as the market lacks momentum. The chances are that BTC will continue seesawing within the current range.
On the downside, the first local support comes at $3,850. It is created by a confluence of SMA50 and SMA100 (1-hour) and the lower boundary of the above-said triangle. Once it is cleared, the sell-off may be extended towards $3,800 (Tuesday’s low comes at $3,796).
BTC/USD, 1-hour chart