- Immediate bottom in place.
- Long term, 6,000 won’t break easily.
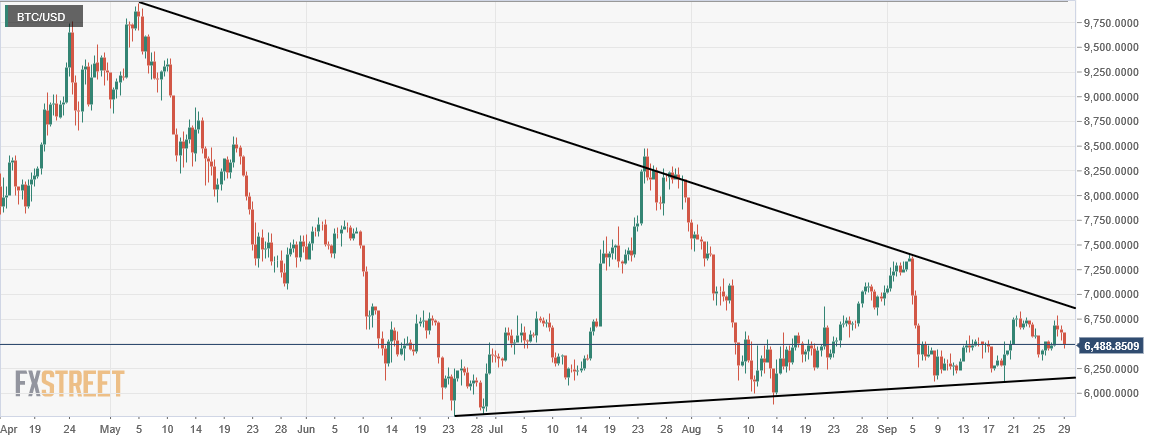
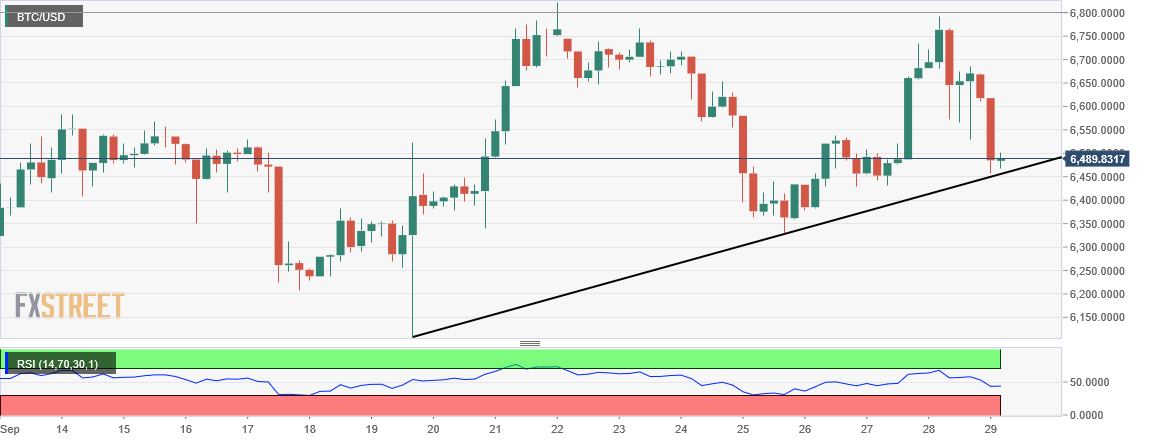
Bitcoin, the largest cryptocurrency by market capitalisation, has found bottom in place for the immediate term and should be able to bounce from the current levels, while in the long term too breaking below $6,000 won’t be a cake walk for the bears.
BTC/USD is down about 2 percent on day at $,6,486 and trading in about 2 percent range for the day in a rising volatility day. On the immediate 240-minute chart, BTC has managed to find a bottom in the form of an ascending trendline and should be able to give a decent bounce from here.
Even if bears are able to break past this short term trendline, in the long term bulls are in a good position to defend their turf as there’s a strong support just above $6,000.
BTC/USD 240-minute chart:
BTC/USD 720-minute chart: