- Bitcoin price surge inhibited by the 50-day SMA .
- BTC bulls must defend the $31,500 support level to avoid further losses.
Bitcoin price continues to bleed since the all-time high (ATH) of $64,805 achieved on April 21. This downswing has since flipped the 200-day, 100-day and 50-day Simple Moving Averages (SMA) from support to resistance. Since May, BTC has spent most of the time hovering around the middle line of the Bollinger Band (BB).
There have been numerous attempts to push the Bitcoin price higher, but the pioneer cryptocurrency as not made any remarkable progress towards the ATH.
- Join one of the crypto signals telegram groups to know when its time to buy or sell Bitcoin.
Bitcoin Price Stuck Below the 50-Day SMA
The Bitcoin price volatility has been decreasing since June 04. The reducing price volatility continues as the outer boundaries of the Bollinger Band (BB) continue squeezing towards the midline. This has seen the BTC price hovering between the 50-day SMA resistance and the $31,500 support wall.
At the time of writing, BTC teeters around $31,400 as bears continue to flex their muscles to push the price below the $31,500 support wall. Note that a daily candlestick closure below this level will firm the bearish grip as losses towards the $30,000 psychological level remain in the offing.
However, a daily closure above the BB mid-line at around $34,00, BTC bulls will attempt to push the Bitcoin price over the 50-day SMA towards the $36,000 resistance level. However, further movement upwards might be delayed by the resistance around the $39,000 area.
Bitcoin Price (BTC/USD) Daily Chart
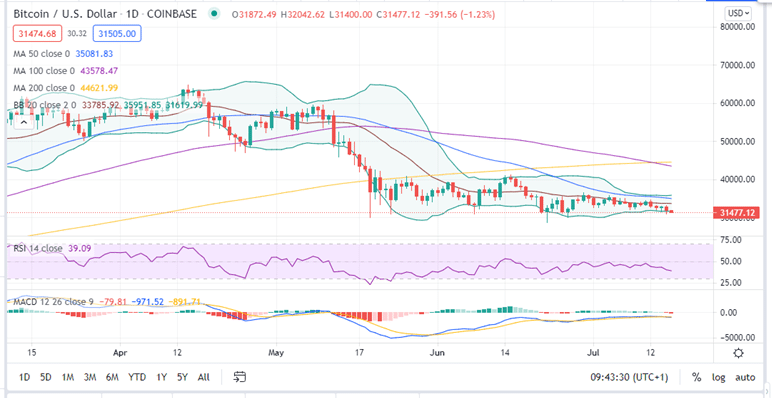
Note that the narrowing of the Bollinger Bands indicate that the Bitcoin price is consolidating. This means any underlying pressure to push BTC upwards will be cancelled by the overhead pressure. If this happens, Bitcoin might continue trading below the 50-day SMA over the next few days.
The sideways price action if validates by the horizontal movement of the Moving Average Convergence Divergence (MACD). This shows that shows that bulls and bears are canceling out.
What next for Bitcoin Investors?
The In/Out of the Money Around Price (IOMAP) by IntoTheBlock indicates that Bitcoin Price is currently sitting on a weak support level around $31,500. At this level, almost 220,000 addresses previously bought approximately 99,000 BTC. Therefore, bulls need to defend this crucial level to prevent any further losses.
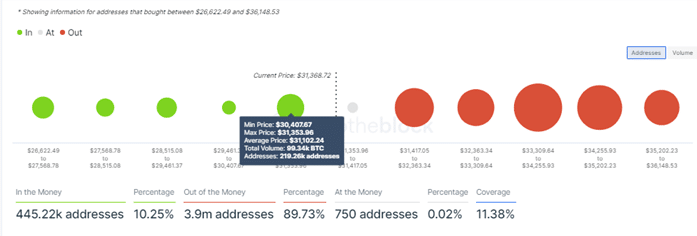
On the flip side, the IOMAP shows that Bitcoin price faces massive resistance upwards. A major resistance zone is between the $33,309 and $34,255 range. At this area, approximately 593 million BTC were previously bought by 1.18 million addresses. Please note that the mid-line of the Bollinger Band currently sits in zone and is currently hindering the rise of the BTC price higher. A break past this barrier will take the Bitcoin price beyond the 50-day SMA at $35,500.
- Seeking to buy crypto, the guide on the best crypto brokers is a good start
Looking to buy or trade crypto now? Invest at eToro!
Capital at risk
