- Bitcoin trades in a relatively tight range on Saturday following Friday’s drop.
- Key support is located in the $44,000-$45,000 area.
- Near-term recovery could lift BTC back to $50,000.
Bitcoin extended its weekly slide and touched its lowest level in more than two weeks near $44,000 on Friday. Currently, BTC/USD is little changed on the day at $46,800 but remains on track to snap a four-week winning streak, losing nearly 20% since Monday.
Buyers manage to defend key support
On the daily chart, the Fibonacci 50% retracement level of the Jan. 28 – Feb. 21 rally at $44,00 seem to have formed strong support for Bitcoin. At the moment, BTC/USD trades a little below the next Fibonacci retracement level, %38.2%, at $48,000. A decisive break above this level is likely to open the door for additional gains toward $50,000 psychological mark, which is also reinforced by the 20-day SMA.
On the other hand, sellers could look to retain control with a daily close below $44,000 and force Bitcoin to edge lower toward $40.000 (Fibonacci 61.8%, 50-day SMA, psychological level).
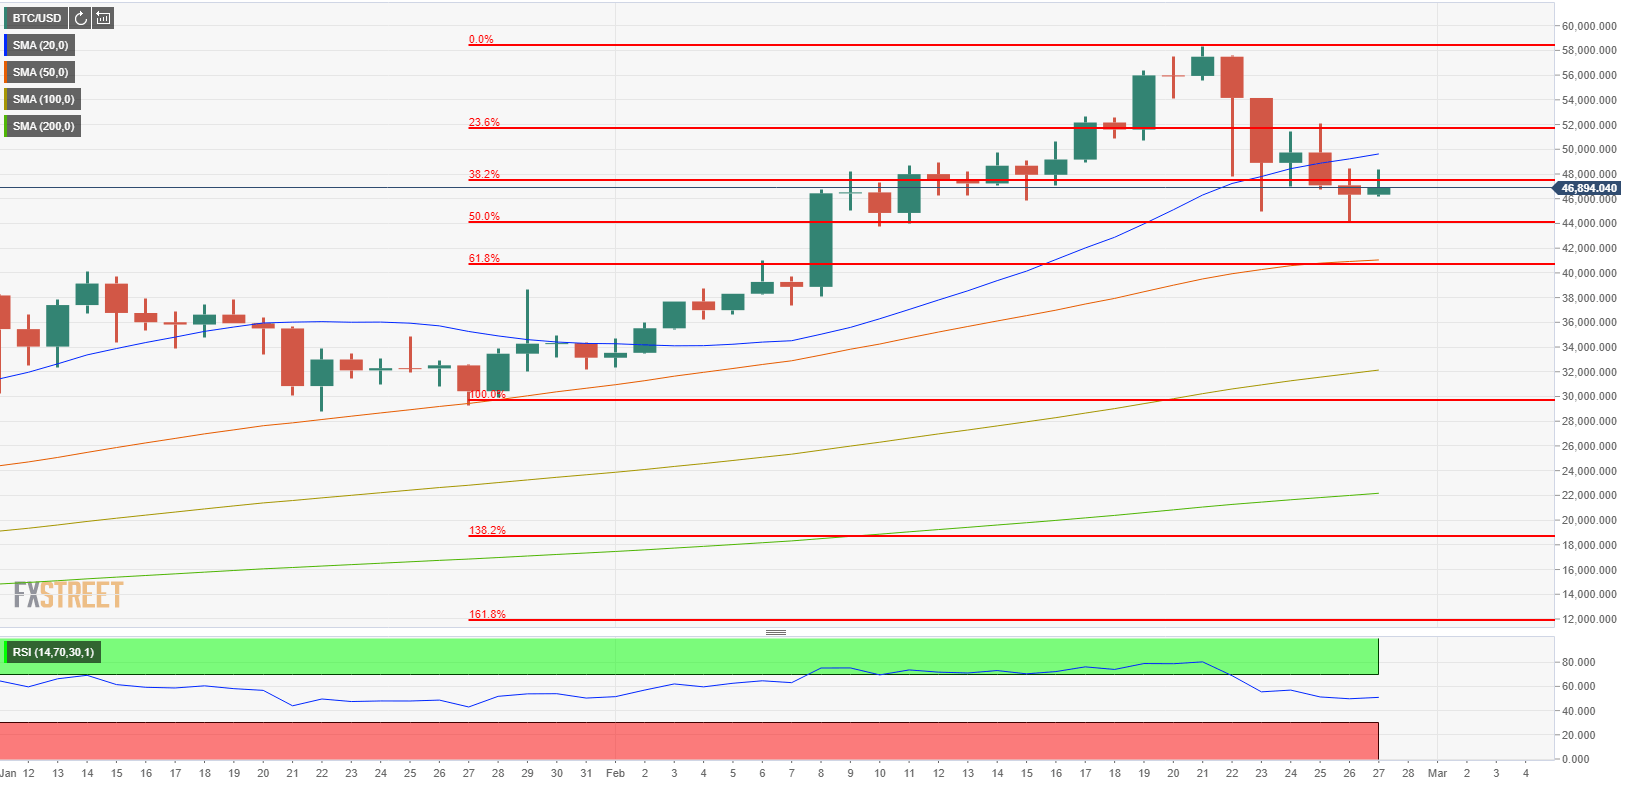
BTC/USD one-day chart
Additionally, IntoTheBlock’s In/Out of the Money Around Price (IOMAP) model confirms that significant support is formed around $45,000 with investors purchasing nearly 430K BTC. Furthermore, the near-term hurdles mentioned above could also be seen on the IOMAP chart as areas of interest.
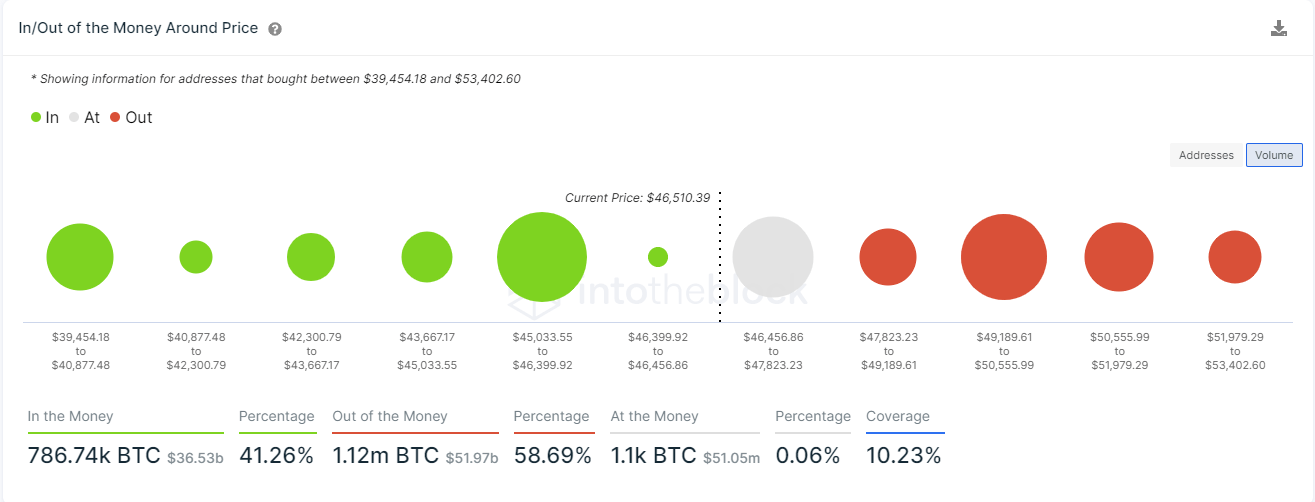
BTC IOMAP Chart
The selling pressure surrounding Bitcoin since the start of the week seems to have softened around $44,000. However, BTC/USD needs to reclaim $50,000 in order to regather its bullish momentum.
