- BTC/USD looks set to record fresh all-time highs above $19K.
- A symmetrical triangle breakout likely on the daily chart.
- Bitcoin on the verge of a bull pennant breakout on 1H chart.
Bitcoin (BTC/USD) staged an impressive bounce from almost two-week lows of $17,578 on Saturday. The most favorite crypto coin fell a hairline short of testing the $19K barrier amid a buying spree witnessed across the crypto board.
Fundamentally, Bitcoin has emerged as a store of value, leaving the gold behind, as many institutional investors are looking to adopt the no.1 digital asset as a viable long-term investment.
JP Morgan Chase said in its latest statement, “The adoption of bitcoin by institutional investors has only begun, while for gold its adoption by institutional investors is very advanced.”
“In a World Gone Digital, #Bitcoin May Surpass #Gold — The past year has been a stepping stone for Bitcoin into the mainstream of investment portfolios and for the digital evolution of money, which should keep the benchmark crypto on an upward price trajectory in 2021,” Mike McGlone, Senior Commodity Strategist at Bloomberg Intelligence tweeted out last week.
The bullish scenario for Bitcoin is also backed by the technical outlooks, as depicted across the different time horizons.
-637434327885146848.png)
BTC/USD: Daily chart
BTC/USD’s journey towards records highs and the follow-through consolidative mode has carved a symmetrical triangle formation on the daily sticks.
The bulls are probing the upper resistance of the triangle at $18,882, with a daily closing above that level needed to validate the bullish breakout. Therefore, all eyes remain on Sunday’s close.
The bullish confirmation could open doors for a retest of the record highs of $19,914 beyond which recapturing the $20K level will be inevitable.
The 14-day Relative Strength Index (RSI) trades flat but holds well above the midline, currently at 56.76, suggesting that there is scope for additional gains.
Further, the price closed above the 21-daily moving average (DMA) for the first time in four days, indicative of the shift towards bullish prospects.
To the downside, the 21-DMA at $18,616 is the immediate cap, below which the triangle support at $17,784 could be challenged.
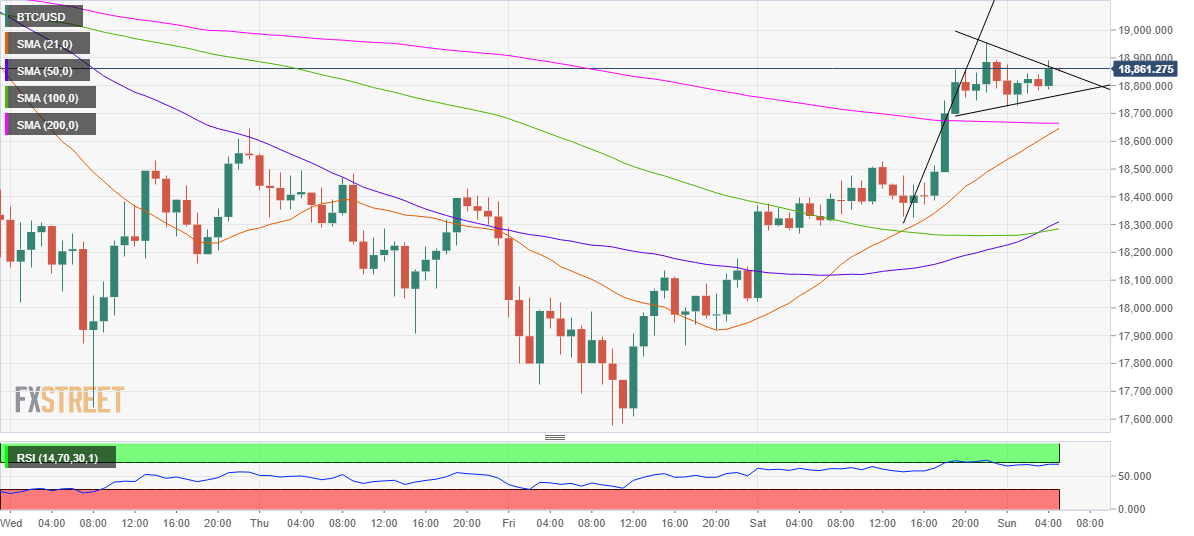
BTC/USD: Hourly chart
Looking at the hourly chart, the no.1 coin has charted a potential bull pennant, awaiting a confirmation above the falling trendline resistance of $18,869.
The hourly RSI lies just below the overbought region, near 68.00, calling for additional upside while the bullish crossover further adds credence to the upbeat momentum. The 50-hourly moving average (HMA) has cut the 100-HMA from below, confirming a bullish crossover.
The buyers look to scale the 19K hurdle en route to the all-time highs.
An hourly closing below the rising trendline support at $18,757 could invalidate the bullish formation, with the next relevant cushion seen at the horizontal 200-HMA at $18,665.
Further south, the bullish 21-HMA at $18,645 could come to the rescue of the BTC bulls.
BTC/USD: Additional levels to watch
