- Bitcoin consolidates the rebound on Sunday before the next leg higher.
- A test of $12K mark remains inevitable amid a potential symmetrical triangle.
- Upside remains more compelling amid a bunch of healthy support levels.
Bitcoin (BTC/USD) sellers continue to lurk above the $11,800 level, limiting the upbeat momentum in the spot so far this Sunday. The most favorite crypto coin consolidates Saturday’s rebound around $11750, almost unchanged on the day, at the time of writing. The market capitalization of the No.1 digital asset stands at $217.17 billion.
Technical Overview
BTC/USD: Hourly chart
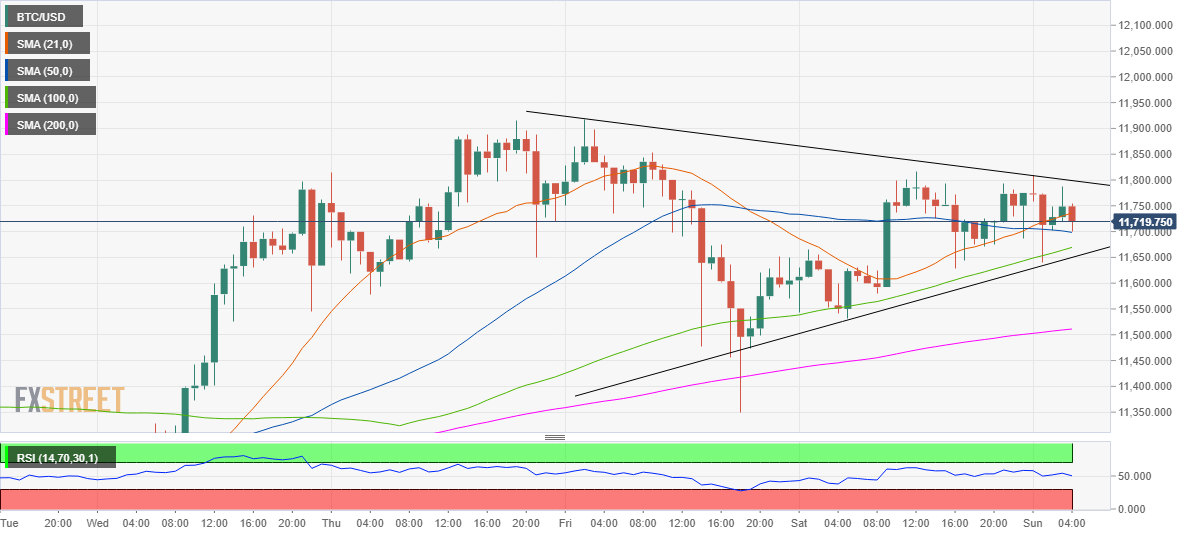
Following Saturday’s renewed $225 uptick to $11,817 levels, the price has entered a consolidative phase while ranging in a symmetrical triangle formation on the hourly chart.
The spot needs acceptance above the falling trendline resistance at $11,800 to confirm the pattern, opening doors towards the yearly highs of $12,112 and beyond.
En route the yearly tops, the BTC bulls could test Friday’s high at $11,918. The next hurdle is aligned at the $12,000 mark.
The hourly Relative Strength Index (RSI) has turned lower but holds above the midline around 50.50, suggesting that the upside bias still remains intact in the near-term.
Meanwhile, the horizontal 50-hourly Simple Moving Average (HMA) at 11,698 guards the downside. A break below which the upward sloping-100-HMA at $11,670 could be tested once again.
The confluence of the rising trendline support and intraday low near $11,645 will be the next cushion.
Selling pressure could intensify below the latter, opening floors for a test of the 200-HMA at $11,511.
To conclude, given a bunch of healthy support levels stacked up, the path of least resistance appears to the upside.
BTC/USD: Additional levels to watch
