- BTC/USD pauses its relentless rise on Sunday.
- Elon Musk’s tweet, Doji on the 1D chart challenge the bulls.
- Overbought RSI conditions also warrant caution for Bitcoin.
The buying interest around Bitcoin (BTC/USD) remains unabated this Sunday, although the flagship cryptocurrency struggles to recapture the $57,000 threshold.
The world’s most favorite digital asset refreshed life-time highs $57,545 on Saturday before tumbling nearly $3,500 on the tweet from the founder of Tesla Inc., Elon Musk.
Musk tweeted out that bitcoin prices “seem high” after BTC/USD’s market value crossed $1 trillion. His comment came in in a response to a user who said gold was better than both bitcoin and cash.
The price of Bitcoin staged a quick comeback from the Musk blow but the further recovery above the $57K mark remains elusive so far, as markets assess the recent surge in the world’s most traded digital asset.
“The Big Short” investor, Michael Burry, warned that governments might ‘squash’ bitcoin and gold to protect their currencies amid rising inflationary pressures, induced by the stimulus-driven post-pandemic economic recovery.
Meanwhile, in a Bloomberg interview on Friday, Binance Co-Founder and CEO Changpeng Zhao (aka “CZ”) explained why there is more potential upside to the price of Bitcoin.
Right now, we just passed the previous peak just by a little bit — It’s only 2.5x. Right now, the fundamentals are much much stronger than three years ago. We see a lot more users, a lot more institutions coming in… we see DeFi taking off taking off… there’s a a lot more activity now in this industry than three years ago…
And also from the user numbers, we see I believe the first time I talked with you guys on either in this channel. We were seeing all-time highs of 300,000 registered new register users per day and now with sustained above that peak sustained on a day-to-day basis.
BTC/USD: Contemplating the next move
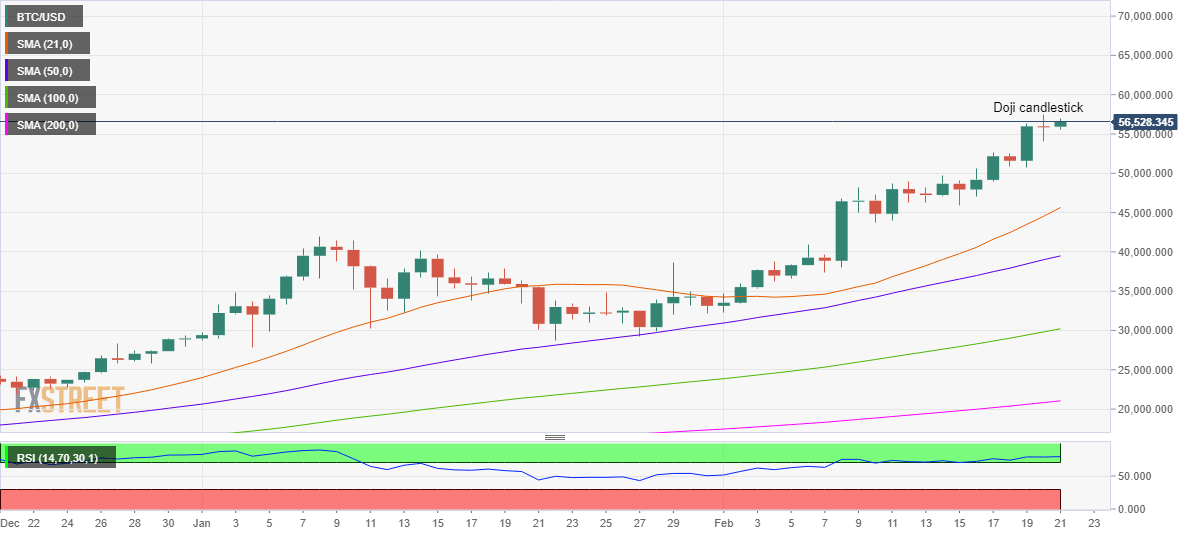
BTC/USD: Daily chart
Bitcoin’s daily chart displays a classic doji candlestick formed on Saturday, which could be indicative of weakening bullish bias.
The 14-day Relative Strength Index (RSI) has turned flat within the overbought territory, prompting a sense of caution for the BTC bulls.
The price of Bitcoin has returned to the green zone this Sunday, attempting a bounce around $56,500, as of writing.
However, the bullish momentum could regain traction only on an acceptance above the $57,000 level. Subsequently, the record highs above $57,500 could be retested.
To the downside, sellers need to find a foothold below Saturday’s low of $54,108 to extend their control, which could bring the $50K level back into play.
BTC/USD: Additional levels to watch
