- Bitcoin Price in a sideways price action defined by a tight range
- BCT upward movement hindered by the 50-day and 100-day SMAs.
- The general expected outlook is bearish.
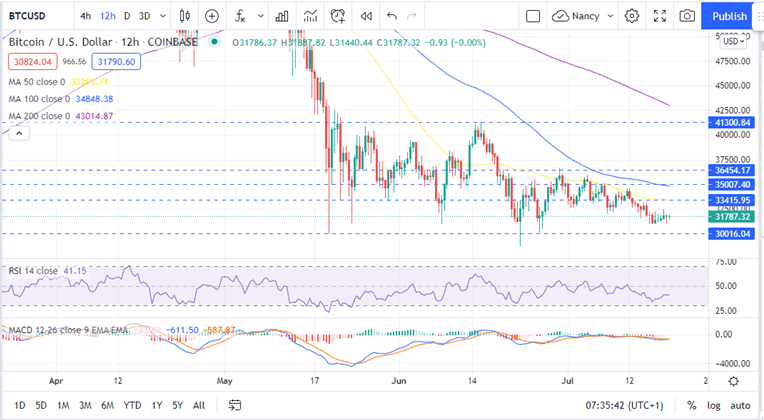
Bitcoin price opened the day on Monday trading in the red as shown on the 12-hour chart. BTC is holding onto crucial support at around $31,100 as bulls attempted to push the price above the $32,500 psychological level. At the time of writing, the biggest cryptocurrency was exchanging hands at $31,787 with no noticeable movement in either direction.
Bitcoin Price in a Tight Range
Bitcoin price has been trading in a tight range between $31,100 and $32,500 since July 15 with little or no movement either way. The appearance of the doji candlestick on the 12-hour chart suggests indecision in market as bulls and bears cancel out. It also suggests that the BTC price could break out either way.
This sideways price action is accentuated by the sideways movement of the Relative Strength Index and the Moving Average Convergence Divergence (MACD) indicators as seen on the chart.
Read our detailed guide for more crypto signals to help you make better trading decisions.
At the moment, the situation seems bearish for the next trading as bears are determined to test new lows at the $30,500 mark. A four-hour candlestick close below the $31,100 support level could see the Bitcoin price swing low below $30,500 to revisit the June 26 low at $30,000 or the June 22 low at around $25,600.
Bitcoin Price (BTC/USD) 12-Hour Chart
The SuperTrend indicator adds credence to the Bitcoin price bearish outlook in the near term. This chart-overlay trend following indicator that uses true averages to signal the degree of price volatility. The SuperTrend indicator on the 12-hour chart indicates that the current BT trend is bearish.
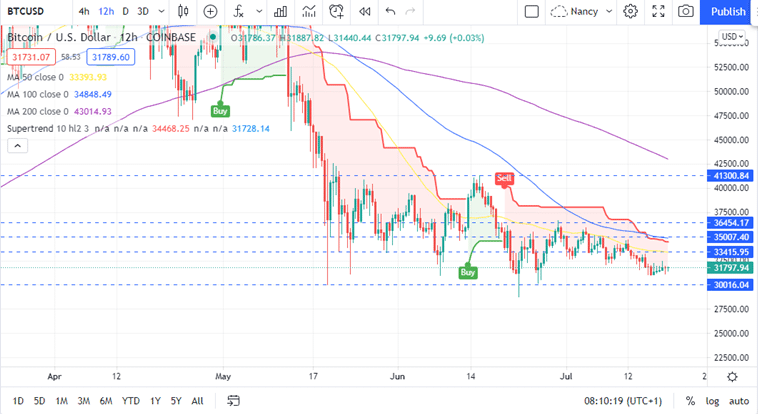
Note that as long as the flagship cryptocurrency continues trading below the SuperTrend line, the bearish leg is set to continue. If this happens, Bitcoin price could go below $30,000 towards $28,000.
BTC Faces an Uphill Task
On the upside, the MACD indicator could send a bullish signal in the near term. This will happen once the MACD line (blue) crosses the signal line (orange). The bullish outlook will be validated further once the MACD crosses the zero line into the positive region.
Realise that Bitcoin’s rally upwards is hindered by immense resistance around $33,400 which coincides with the 50-day Simple Moving Average (SMA). Even if bulls are able to overcome this barrier, the resistance and 100-day SMA at $35,000 will be difficult to overcome. Any movement further up will be met by the resistance level at $36,400.
Therefore, the general outlook is that BTC is sitting on weak support and that the more likely price movement is downward rather than upward.
-If you are looking to buy some Bitcoin, out How to Buy Cryptocurrency guide is a good start.
Looking to buy or trade crypto now? Invest at eToro!
Capital at risk
