- Bitcoin price is trading in positive territory, up 0.50% in the second half of the session.
- BTC/USD remains at risk to further downside as the price beached the psychological $9000.
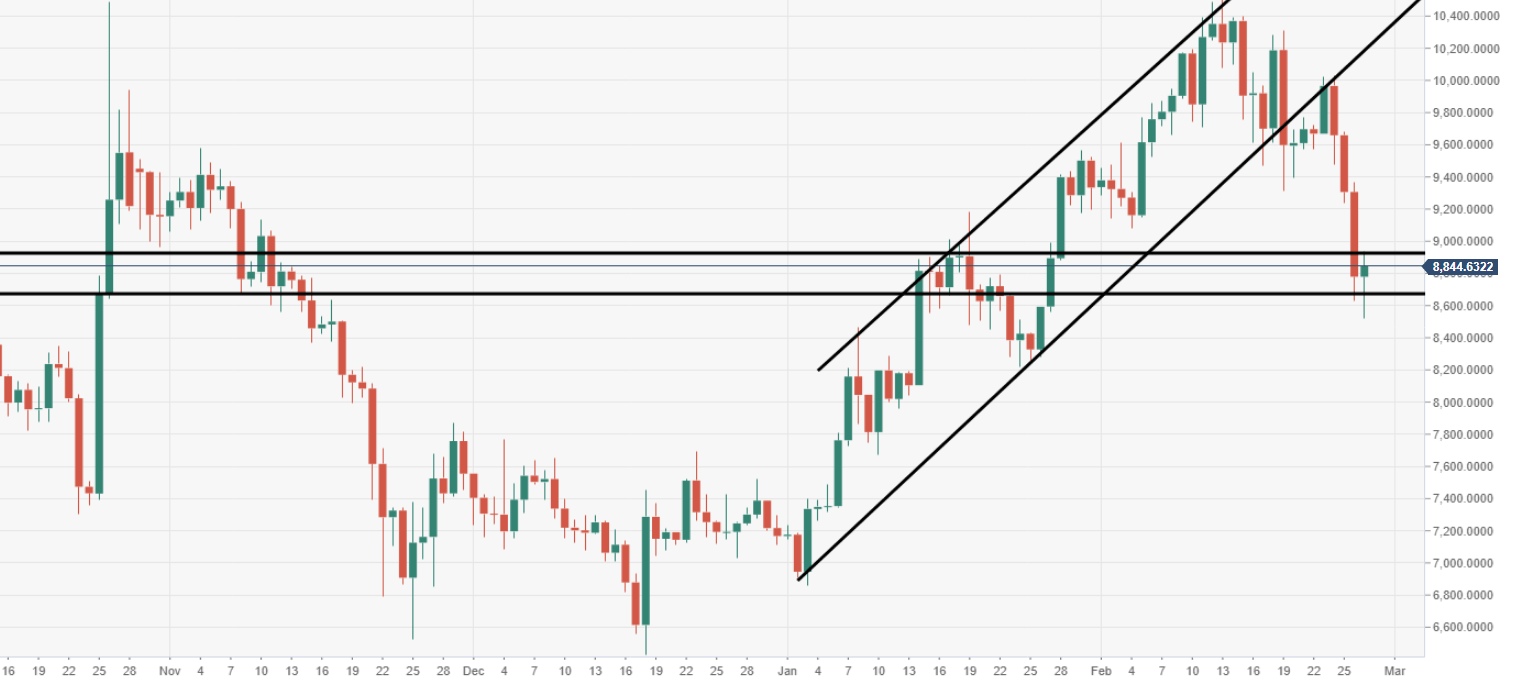
- The noted key prior support, is now likely to act as a stubborn resistance area.
BTC/USD daily chart
The next major daily demand zone eyed at a range of $8,400 – 8,000.
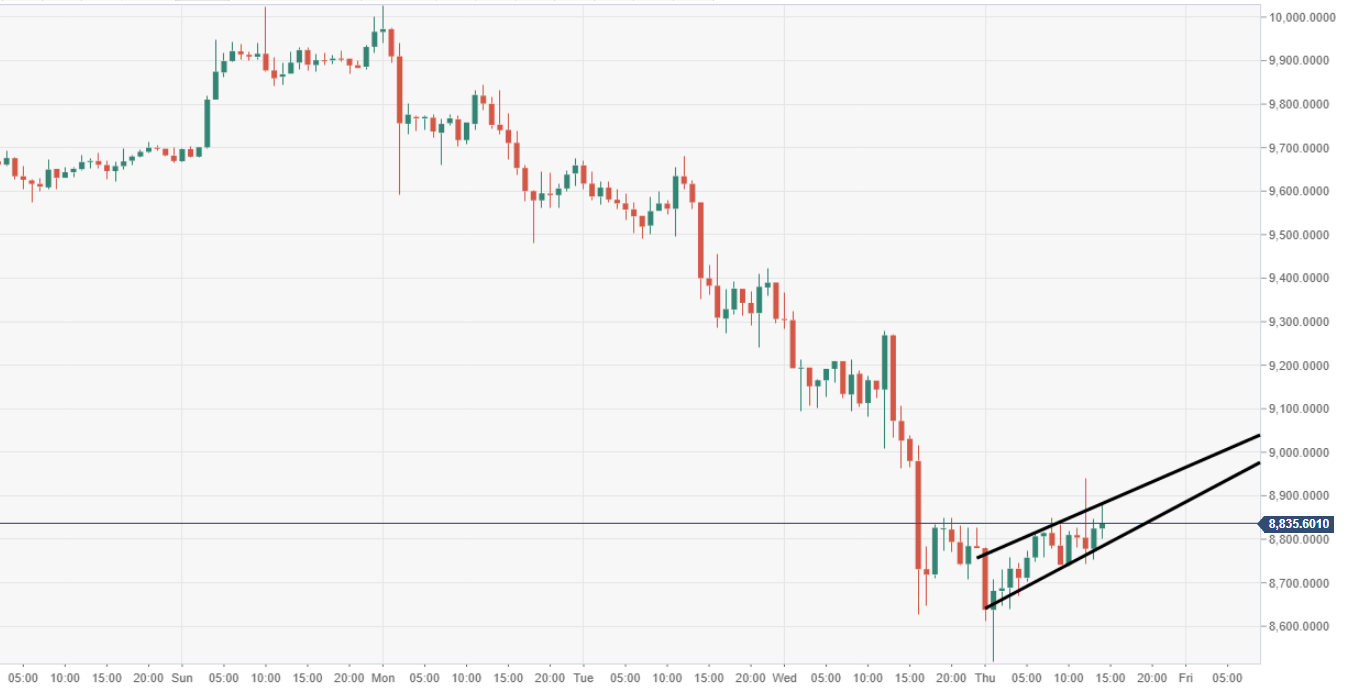
BTC/USD 60-minute chart
Near-term price action is moving within a bearish flag structure via the 60-minute.
Spot rate: 8835.61
Relative change: +0.50%
High: 8939.20
Low: 8519.63
