- Bitcoin upside is currently restricted at the 61.8% Fib retracement level.
- Technical indicators show that the path of least resistance is to the downside until a support is found.
Bitcoin upward trajectory has surprised many in the cryptocurrency industry. The bullish trend smashed through the critical yet coveted resistance at $8,000. Furthermore, it has exchanged hands above $8,400. Although BTC/USD has declined on Friday morning and is currently trading slightly below $8,250, FXStreet’s Yohay Elam in his latest price analysis places the next target for Bitcoin at $8,663. He also notes that the Bull Run is continuing in spite of the delay in the approval Bitcoin ETF.
Bitcoin upside is currently restricted at the 61.8% Fib retracement level taken between the highs of $8,480.70 and $7.967.06 lows at $8,283.98. Moreover, the 2-hour 100 Simple Moving Average at $8,349.99 will limit upside movement above the next short-term resistance target at $8,300. Similarly, technical indicators show that the path of least resistance is to the downside at the time of press. The MACD momentum indicator is dipping further into the negative territory, besides a broader look at the chart shows that there is selling bear pressure rising.
On the downside, the trendline which coincides with the 50% Fib level with the last high leg of $8,480.70 and a lower leg of $8,283.98 will stop the currently slide slightly above $8,220. Significantly, there are more support areas highlighted by the Fibonacci levels above $8,000.
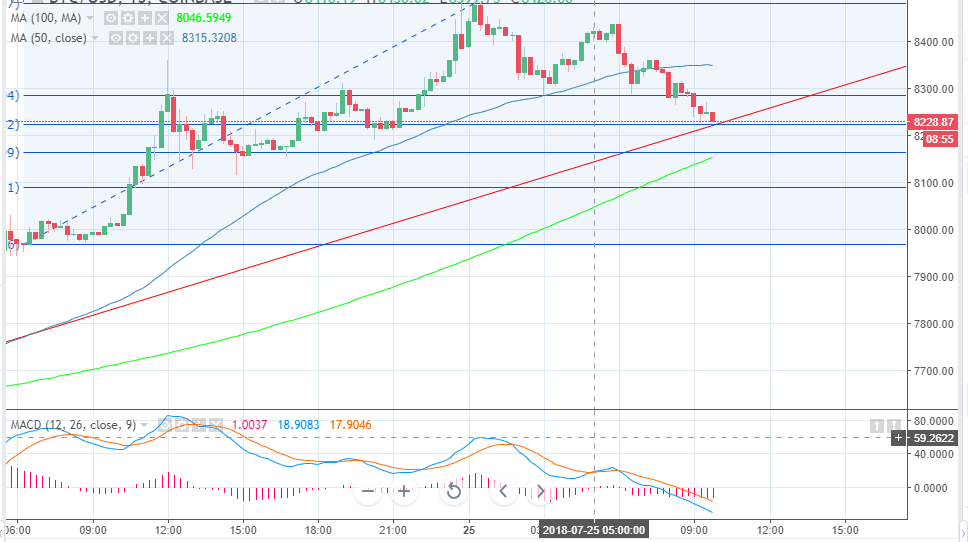
BTC/USD 15-minutes chart