- Bitcoin gained over $600 in less than one hour on Tuesday.
- Tom Lee observations reveal that this price movement is not new and that is has happened before since 2009.
Bitcoin blasted its way through the critical resistance at $6,800, opening the door for an extended bullish movement above $7,000. In an earlier analysis, we explored Bitcoin price movement on Wednesday where it exchanged hands slightly above $7,500. However, as stated, the crypto corrected lower but the declines were short-lived above $7,330.
The trend is still bullish above $7,400, besides the buyers seem to be consolidating gains. Similarly, a support around this level will allow the price to gain momentum to retest $7,500 and possibly attack the medium-term resistance at $7,600. Although the price is somehow bullish, indicators like the Relative Strength Index (RSI) and the Stochastic are pointing downwards to signal that the sellers are seeking to regain control in the short-term.
Bitcoin gained over $600 in less than one hour during the evening trading session on Tuesday. While no news can be correlated to the surge, Fundstrat’s co-founder and top cryptocurrency industry analyst, Tom Lee has demystified the unexpected price rally. In an interview with CNBC Lee used a chart to explain the price movement. AMB CRYPTO news website explains that Tom Lee “used a chart to indicate the 200-day moving average for Bitcoin for the last one year. He then showed that currently, Bitcoin is trading 30% below the 200-day moving average of last year which is a positive sign.”
Tom Lee observations reveal that this price movement is not new and that is has happened before since 2009. It took place on October 2011 and again in December 2009. He said in continuation:
“”¦why is that significant, well no.1, Bitcoin bottomed within a month here [October 2011] and it bottomed within a month here [December 2014] but I think it tells us something even more important. Not the next month, it’s telling us that if you look for in the next six months you’re gonna do pretty well.”
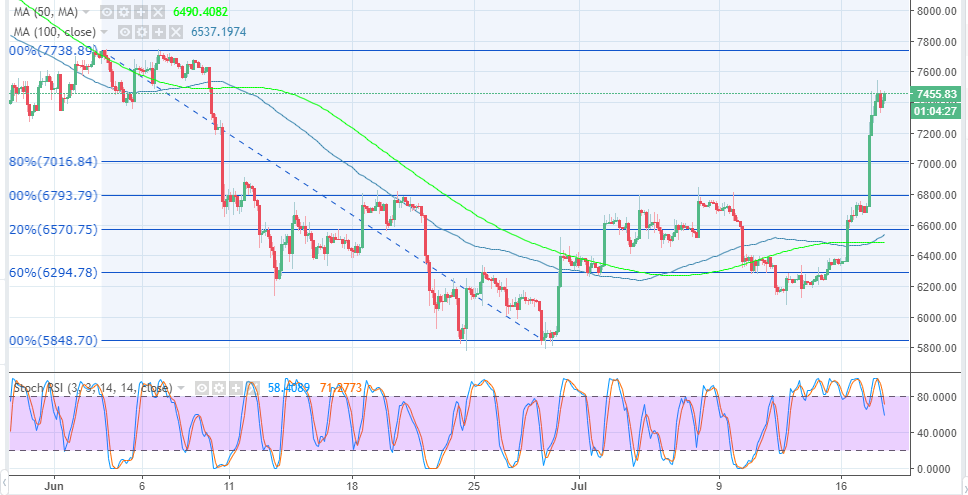
BTC/USD 3-hour chart