- Bitcoin rises for the third straight day on Saturday.
- RSI indicator on the daily chart continues to float above 70.
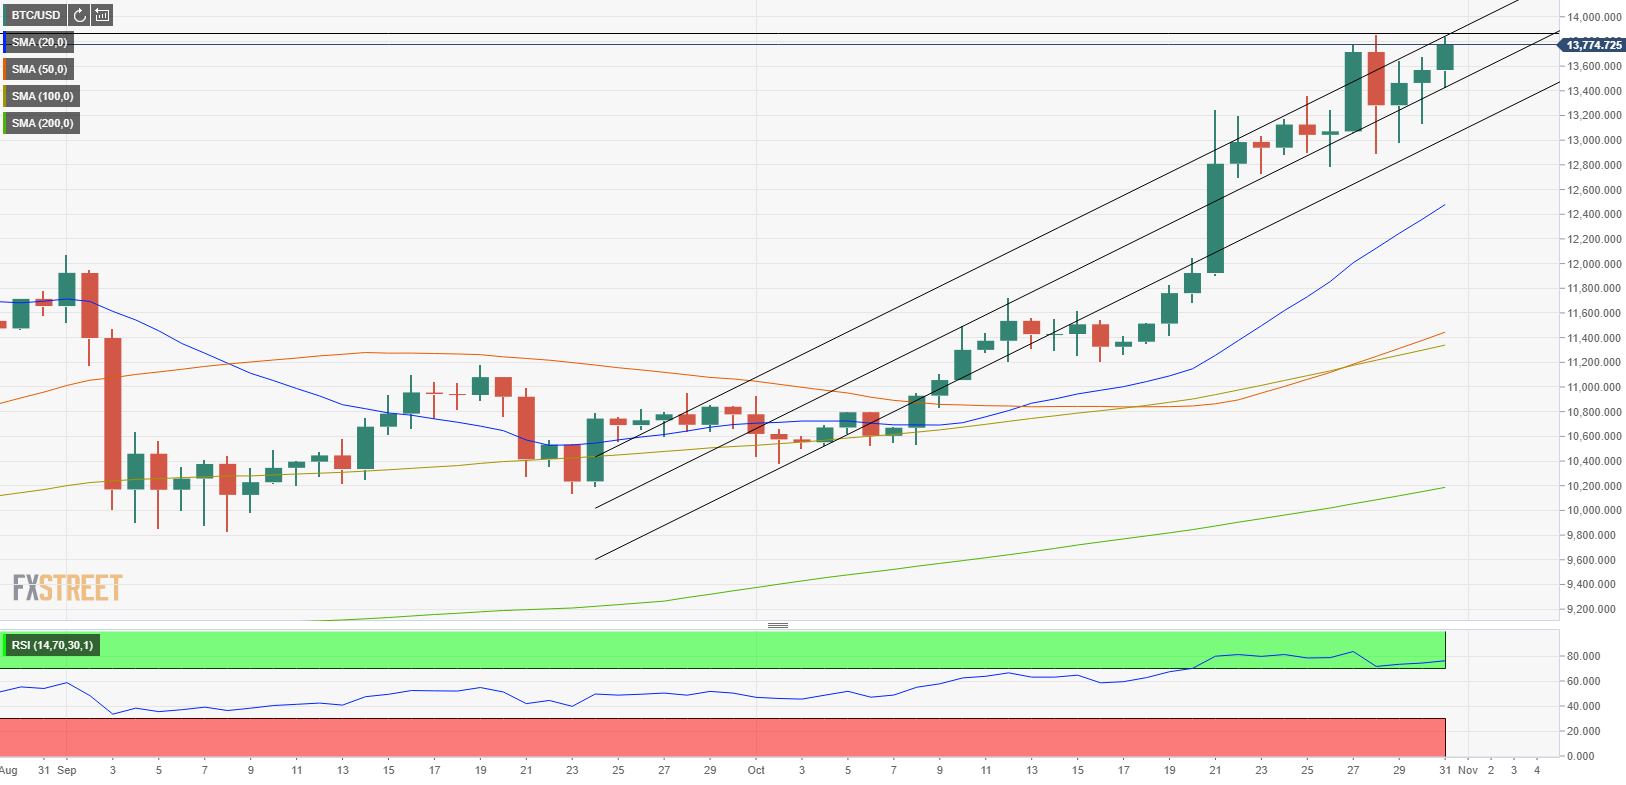
- Technical correction is likely if BTC/USD fails to break above $13,860.
After climbing to its highest level since June 2019 at $13,863 on Wednesday, Bitcoin staged a technical correction and closed the day nearly 4% lower. However, the bullish momentum started to regather strength in the second half of the day and the BTC/USD pair is rising for the third straight day on Saturday, gaining 1.15% at $13,727.
Bitcoin technical outlook
On the daily chart, the Relative Strength Index is floating in the overbought area above 70 for the 10th straight day on Saturday. Additionally, the price seems to have reached the upper limit of the linear regression channel coming from early October, suggesting that BTC/USD could retreat toward $13,600, the middle line of the channel, before attempting to break higher. Nevertheless, the 20-day, 50-day, 100-day and 200-day SMAs all continue to edge higher, showing no significant bearish pressure for the time being.
On the upside, $13,860 aligns as the initial resistance. A daily close above that level could lift the price to $14,000 psychological level. On the other hand, Bitcoin could retreat toward the lower limit of the channel, currently located at $13,300, if it breaks below $13,600.