- Bitcoin price is trading in positive territory, up 5.05% in the second half of the session.
- BTC/USD has managed to find some critical support, at an ascending trend line.
- The noted support has been comforting the price since late December 2019.
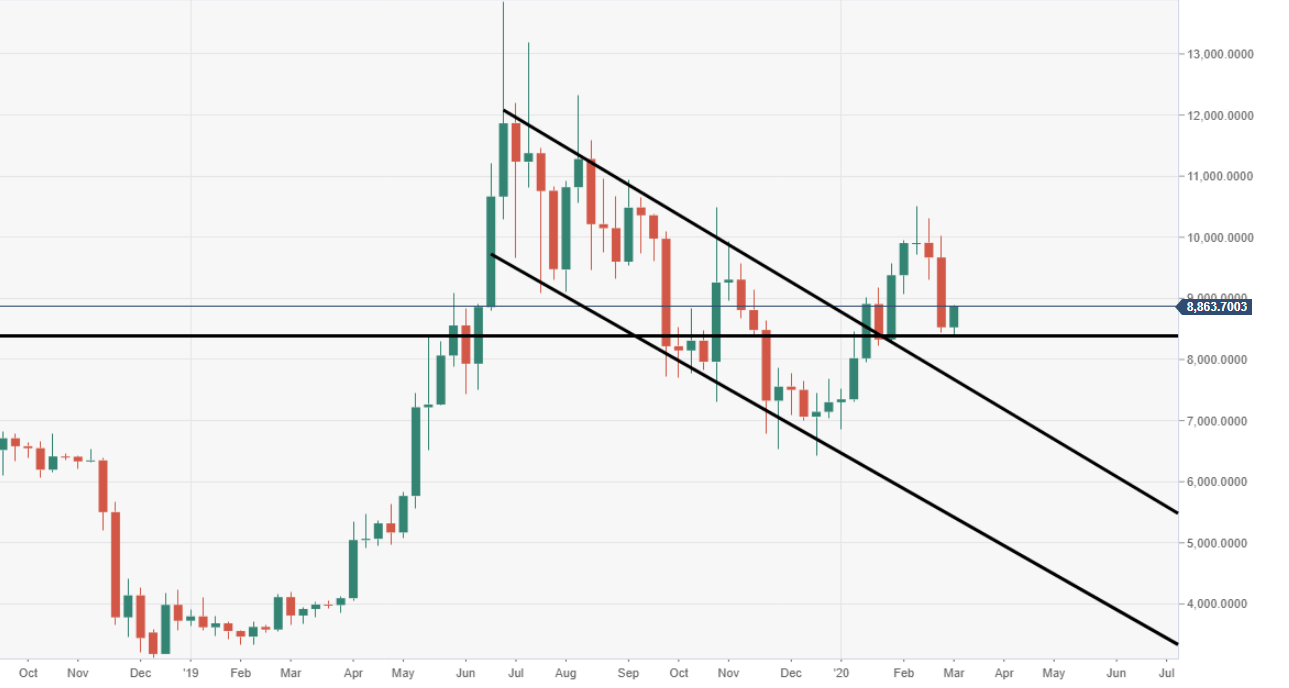
BTC/USD weekly chart
The price last week closed heavily in the red, it’s worst weekly performance since November 2019.
BTC/USD daily chart
Bears smashed out of a range-block formation, which inviting a strong wave of downside pressure.
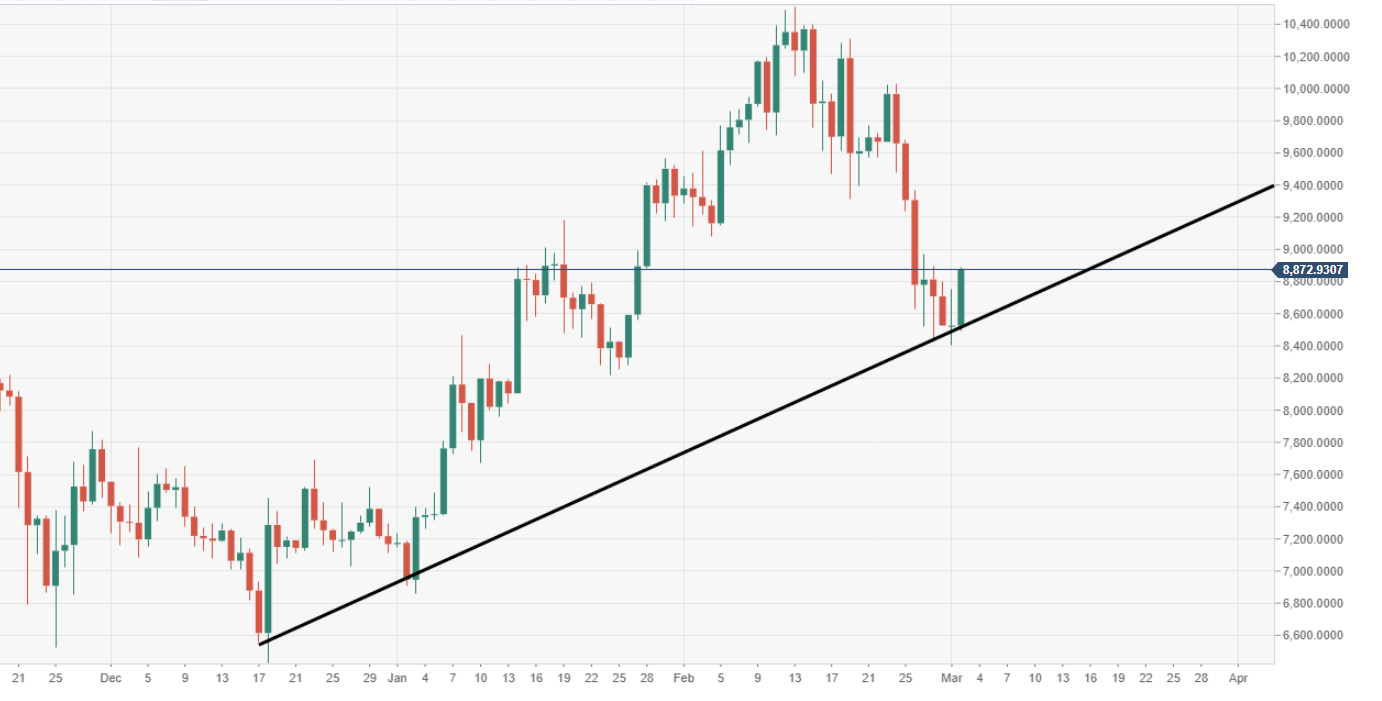
Spot rate: 8872.93
Relative change: +5.05%
High: 8886.02
Low: 8489.52
