- Bitcoin extended losses below 5,450 on Wednesday before finding solace at $5,623.20.
- Trends of the MACD show that the price could breakdown further.
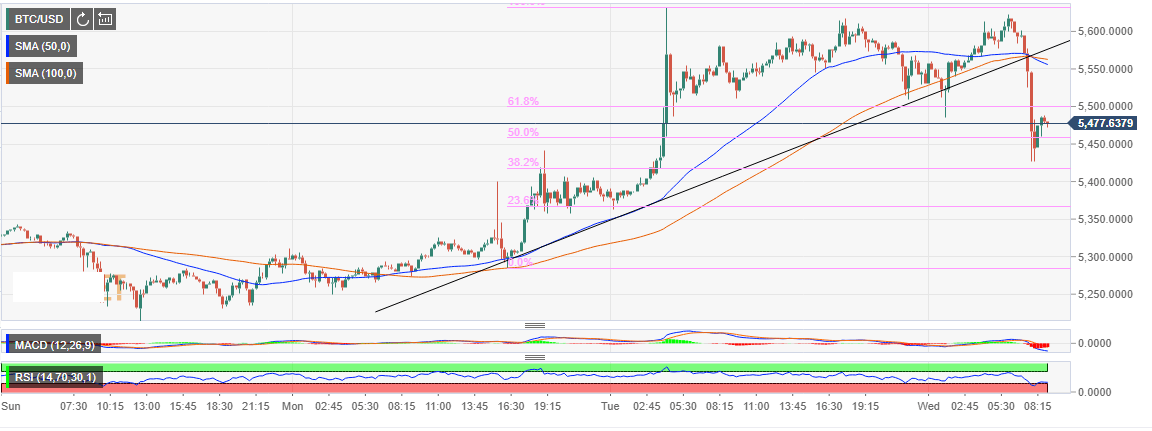
Bitcoin has just slowed down from a flash drop move from an intraday high around $5,623.20. The rising trendline support which had formed a confluence with the 50 simple moving average (SMA) and the 100 SMA 15-minutes at $5,567.26 could not prevent the massive bear force. Instead, BTC/USD spiraled below the 61.8% Fib retracement level of the last drop from $5,632.52 to a low of $5,284.88 at $5,500.
The losses extended below $5,450 but the buyers found balance and solace at $5,623.20. The support has given way for a correction above $5,450. Bitcoin currently exchanges hands at $5,483 while facing resistance from the broken support at the 61.8% Fib level.
In spite of the slight upside correction from the support, Bitcoin still has a bearish outlook especially in the short-term as observed using the RSI and the MACD. The RSI in the same 15-minutes range is yet to make any significant movement after recovering from the oversold levels around 20.68. The indicator is ranging at 37.93 to show that BTC/USD is inclined to move sideways.
Trends of the MACD show that the price could breakdown further. The indicator’s divergence is still increasing in the negative zone. Other support levels include $5,350, $5,300, $5,250 and $5,200 in the event declines are to extend below the support established at $5,623.20.
BTC/USD 15-minutes chart