- BTC/USD is range-bound above $11,000 handle.
- A sustainable move above $12,000 is needed to mitigate the bearish pressure.
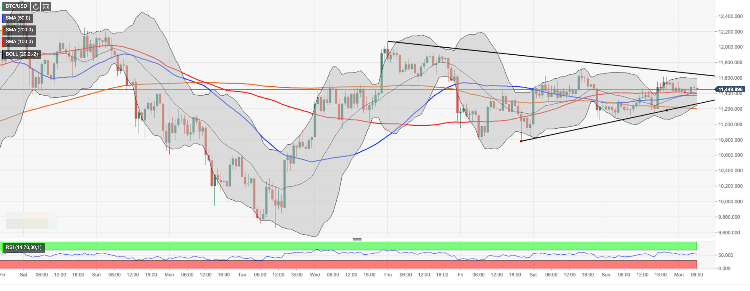
Bitcoin is changing hands at $11,480, mostly unchanged since the beginning of the Asian session on Monday. The first digital currency is locked in a symmetrical triangle pattern, which means that the direction of a breakthrough will define the short-term momentum of the coin.
Bitcoin’s technical picture
The initial resistance for BTC/USD comes at $11,650. This barrier is created by a confluence of the upper line f the above-said triangle and the upper boundary of 4-hour Bollinger Band. A sustainable move higher will open up the way towards a new bullish goal at $12,000. Once this psychological handle is out of the way, the upside is likely to gain traction with the next focus on $12,400 (June 28 high) and $13,000.
On the downside, the initial support is created by a confluence of the lower boundary of the triangle pattern, SMA100 (Simple Moving Average) and the middle line of Bollinger Band on 4-hour chart. This strong barrier is closely followed by a critical $11,000 and the lower boundary of 4-hour Bollinger Band. The next support $10,400 with Pivot Point 1-day Support 1 and Pivot Point 1-week Support 1.
Considering that the area both above and below the current price is packed with strong technical levels, a sustainable move in either direction might trigger a strong movement.
BTC/USD, 1-hour chart