- BTC/USD has resumed a recovery after moving below $9,500 during early Asian hours.
- The critical resistance of $10,000 stays untouched so far.
Bitcoin (BTC) has extended the recovery from the intraday low into the US opening. At the time of writing, BTC/USD is changing hands above $9,700, mostly unchanged both on a day-to-day basis and since the beginning of Monday. On the intraday charts, BTC is supported by 1-hour SMA50 (currently at $9,600), while the ultimate bullish target is created by a psychological $10,000.
The short-term momentum remains bullish, with the RSI on the intraday charts pointing to the North, which means, the coin may continue the recovery.
BTC/USD 1-hour chart
-637254105662694927.png)
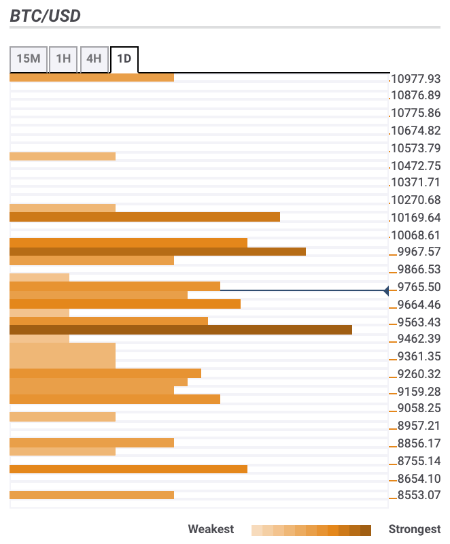
Let’s have a closer look at support and resistance levels clustered around the current price.
Resistance levels
$9,950-$10,00 – the highest level of the previous week, the upper line of the 1-hour Bollinger Band, Pivot Point 1-month Resistance 1
$10,160 – Pivot Point 1-week Resistance 1, the upper line of the daily Bollinger Band
$10,500 – Pivot Point 1-day Resistance 3
Support levels
$9,600 – 1-hour SMA50 and SMA100, 15-min SMA100
$9,500 – the highest level of the previous month, daily SMA5
$9,000 – Pivot Point 1-day Support 1, the middle line of the daily Bollinger Band