- Bitcoin price is trading in positive territory, up 2.95% in the second half of the session.
- BTC/USD price action has been stuck within consolidation mode for going on eight sessions.
- The key for greater upside will be for a break down of the $9500 price barrier.
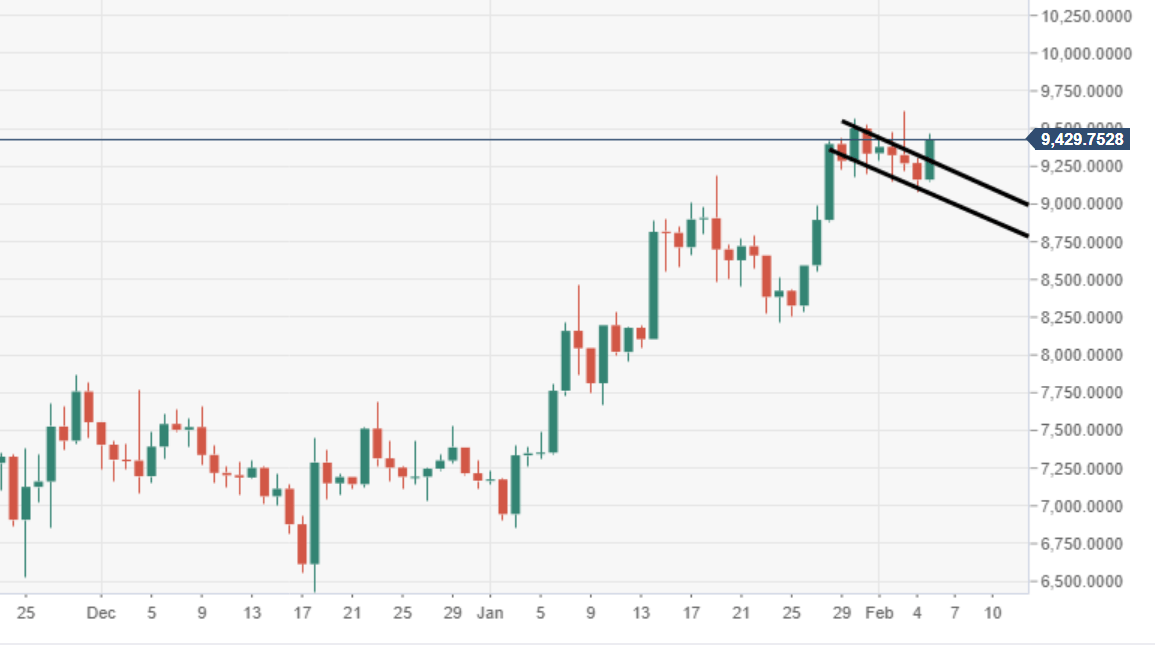
BTC/USD daily chart
The price is having some difficulty with breaking down the high area in November 2019, as noted above, 9200 – 9500 price range.
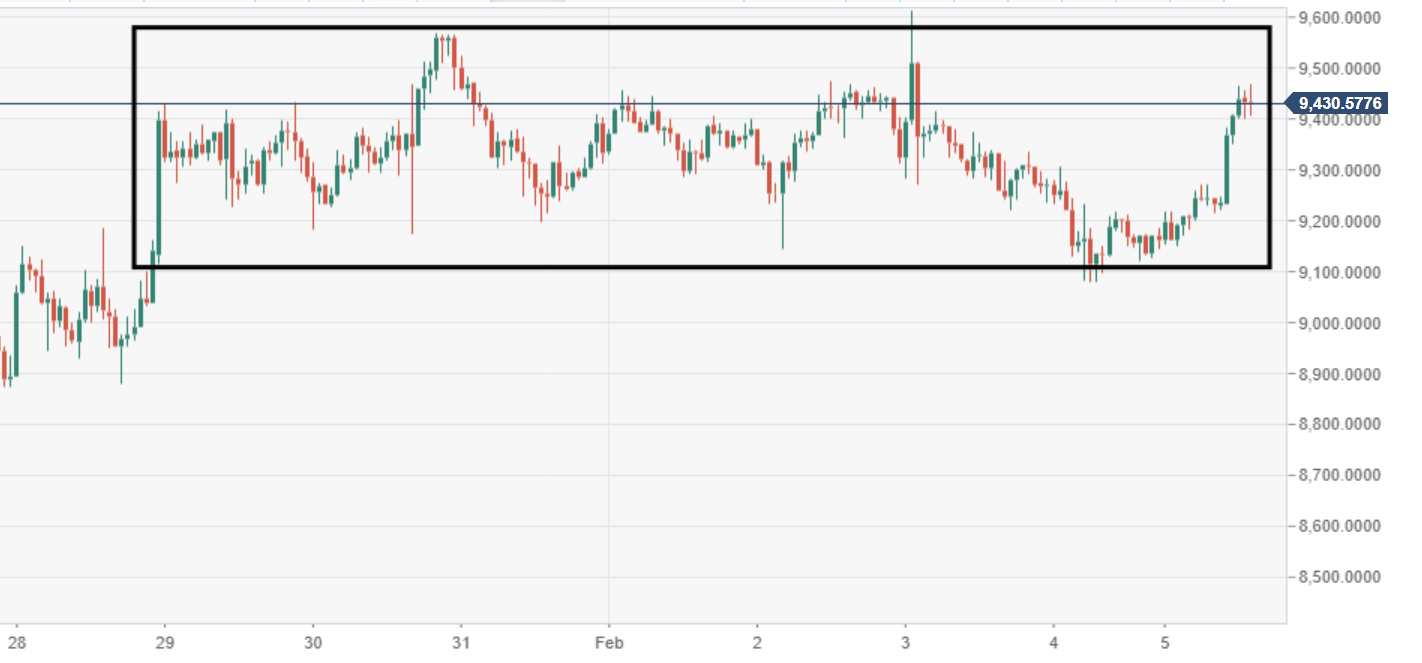
BTC/USD 60-minute chart
Price action has been narrowing within a range block formation via the 60-minute chart view.
Spot rate: 9428.50
Relative change: +2.90%
High: 9271.40
Low: 9150.00
