- Weekly candlestick is looking very attractive for a big potential reversal to come.
- September 2017 produced a similar candlestick in the week of September 18th 2017, before the huge bull run up until December.
The Bitcoin price was seen down a chunky 6% in the latter stages of trading on Friday, after taking a beating in afternoon trading. The big $4000 mark was under heavy threat at one point, however the buyers managed to protect this.
Looking via the weekly chart view, the current candlestick is looking to be forming a reversal doji. Should this be the case, markets can look at expecting a decent bull run next week. The eventual move back to the upside could be fast.
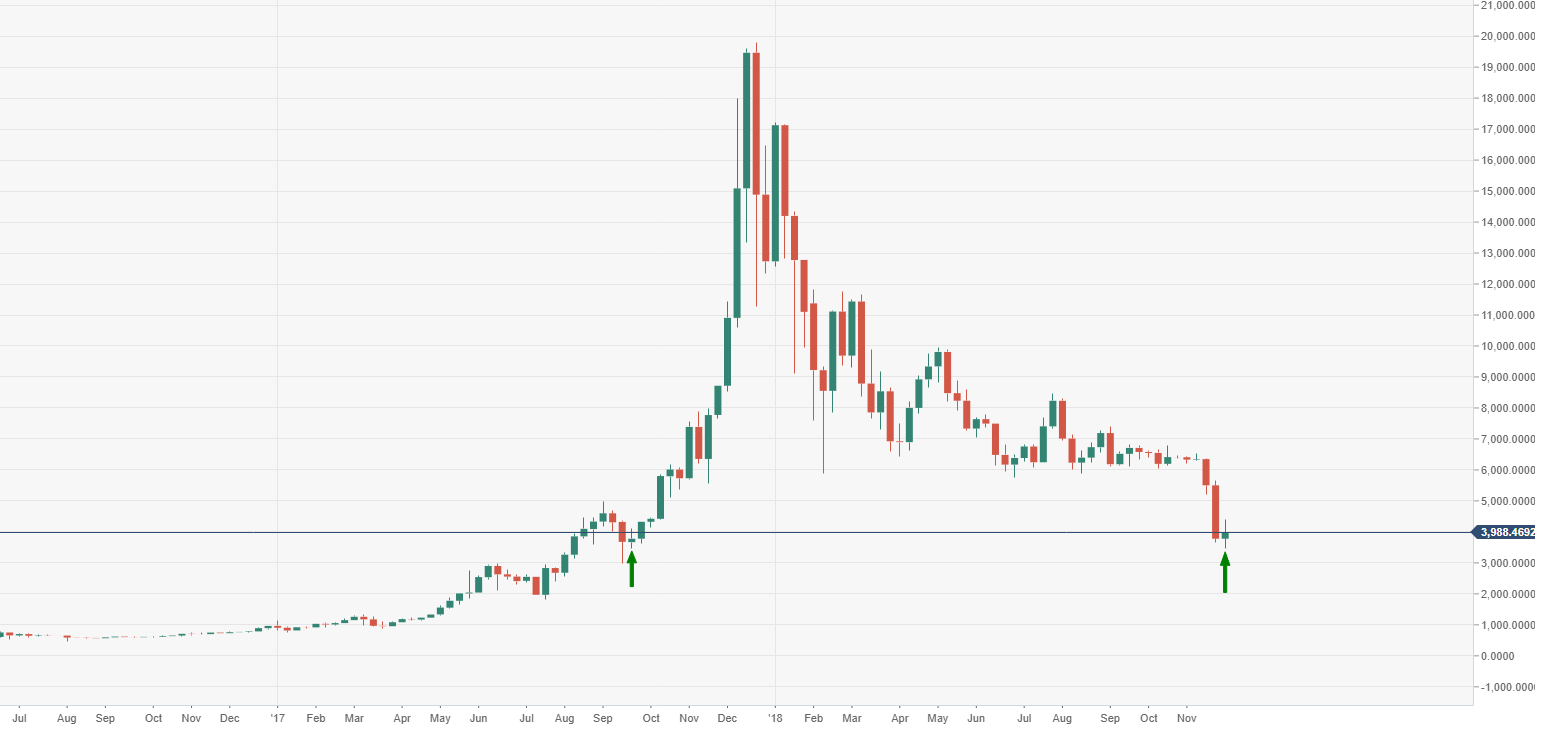
There isn’t much in the way of resistance until the big $7000 figure, when looking at the weekly view. Interesting to note that back on week of 18th September, the weekly candlestick produced a doji, around current levels. The following week was the start of the huge bull run seen from September to December.
BTC/USD weekly chart view