- BTC faces ample resistances ahead.
- Consolidation is the only thing visible.
Bitcoin the largest cryptocurrency and the poster boy of crypto world, can’t decide what it wants to do as the price has been oscillating between $6,000 and $7,000 for quite some time now.
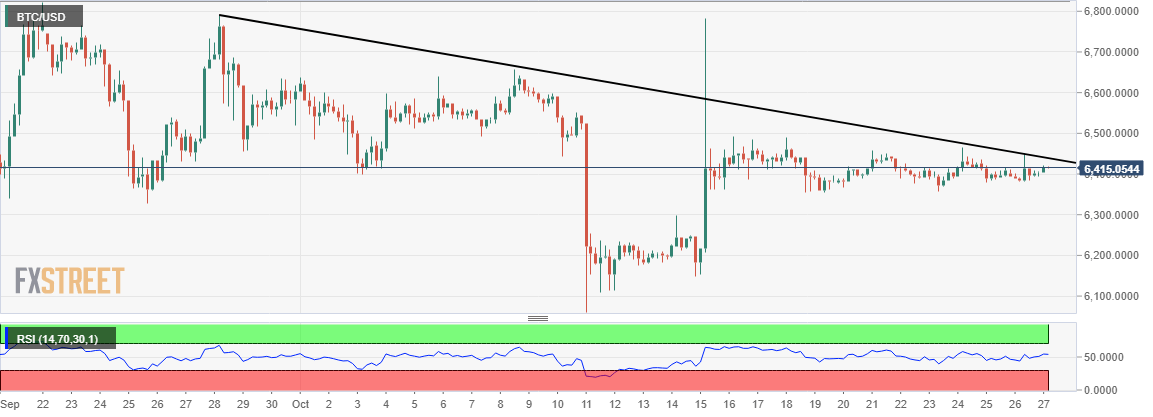
BTC/USD is up 2 cents of a percent at $6,415 and trading in less than half a percent range for the day, pity for an asset class whose second cousin is volatility. On the 240-minute chart of the crypto, BTC has been finding it difficult to cross past this descending trendline and it needs a lot of push and momentum by its side to sustain higher levels.
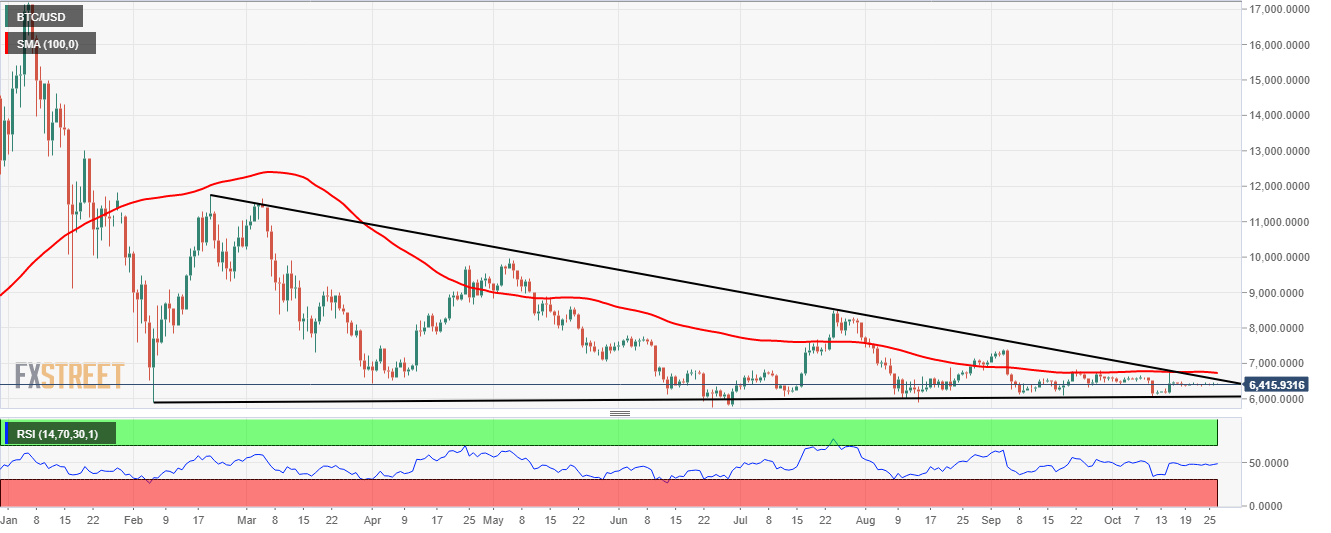
Even if bulls manage to cross this short term resistance, there are other bigger ones on the daily chart, just above this one above $6,500 in the form of descending trendline of the falling wedge and 100 days SMA above $6,700.
BTC/USD 240-minute chart:
BTC/USD daily chart: