- BTC/USD recovered from the recent lows, but the upside is limited.
- Bulls have to take out $3,600 to improve sentiments.
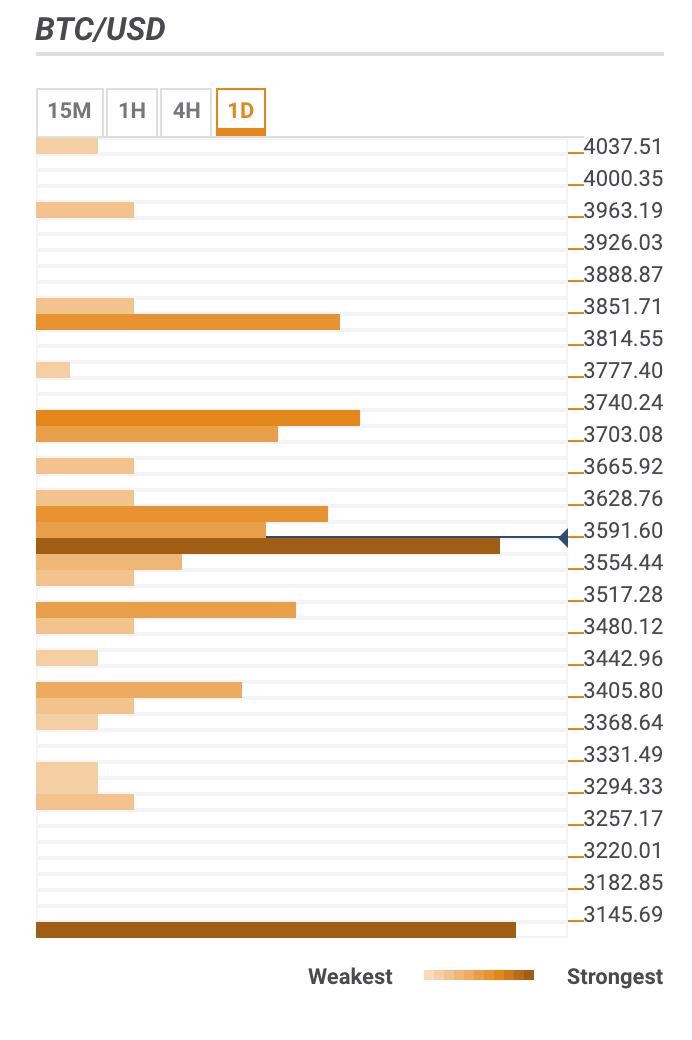
BTC/USD is changing hands at $3,568 amid expanding volatility. The coin attempted to test $3,600 handle, but the upside momentum faded away.
BTC/USD the daily confluence detector
Below the current price, the BTC/USD is supported by a vast number of strong technical indicators clustered around $3,550 handle. They include 23.6% Fibo retracement daily and 38.2% Fibo retracement weekly, Bollinger Band 1-hour Lower, 38.2% Fibo retracement Monthly, Bollinger Band 4-hour Middle, Bollinger Band 15-min Lower and a set of SMA levels.
Once is area is cleared, psychological $3,500 will come into focus; However, the previous week low at $3,480 is considered to be a stronger hurdle. It is strengthened by 61.8% Fibo retracement Daily and Pivot Point 1-month Support 1.
A sustainable move below will open up the way towards interim support at $3,400 (Bollinger Band 1-day Lower and 23.6% Fibo retracement Monthly), and to $3,126 – the lowest level of 2018.
On the upside, the immediate recovery is limited by a confluence of technical levels, including, Bollinger Band 1-hour Middle, Bollinger Band 1-hour Upper, Bollinger Band 15 min Lower, SMA200 1-hour, SMA50 4-hour, and SMA100 1-hour. This resistance area spreads from the current price up to $3,600. This level is vital for further Bitcoin recovery. Only a sustainable move higher will unleash the bullish potential and push the price towards the next target at $3,700 with SMA100 4-hour and SMA50 daily located on approach.
This resistance is closely followed by Pivot Point -day Resistance 2, Pivot Point 1-week Resistance 1 and Bollinger Band 1-day Middle at $3,750. Once above, the recovery will gain traction with the next focus on $3,850 (Pivot POitn 1-week Resistance 2, Pivot Point -day Resistance 3 and 61.8% Fibo retracement Monthly.
BTC/USD, 1D