- Bitcoin price breakout above the upper tip of a rising channel to confirm a bullish breakout.
- BTC needs to flip $46,500 to support to re-start the bullish leg.
- MACD and RSI technical indicators confirm Bitcoin’s bullish narrative.
Crypto traders are becoming increasingly bullish as some altcoins record double-digit rallies over the past few days. Sustaining this bullish momentum will need support from the wider market including the direction the Bitcoin price will take in the short term.
At the moment, BTC/USD price is consolidating under $46,500 after recording less than 1% gains over the last 7 days.
Bitcoin Price Forms a Rectangle Pattern in a Horizontal Price Action
Since August 13, BTC has been trading sideways between the $45,285 and $48,046 price range. After falling below the $30,000 psychological level on July 20, recovery began that saw bulls regain control of the market flipping the 50, 100 and 200 Simple Moving Averages (SMA)s from resistance to support. This represents a 65% rally to the August 14 high around $48, 050.
At the time of writing Bitcoin teeters around $46,207 and appears to have formed a rectangle pattern on the four-hour chart. Note that the rectangle pattern does not have defined bullish or bearish breakout, but breaking above the upper boundary of the rectangle near the August 14 high around $48, 050 will predict a bullish move for BTC.
BTC seems to be battling immediate resistance posed by the middle boundary of the rectangle pattern at around $46,500. For a bullish move to be confirmed, BTC price must close the session above this level and go above the rectangle at $48,040. This coincides with the upper tip of the ascending channel.
BTC/USD Four-Hour Chart
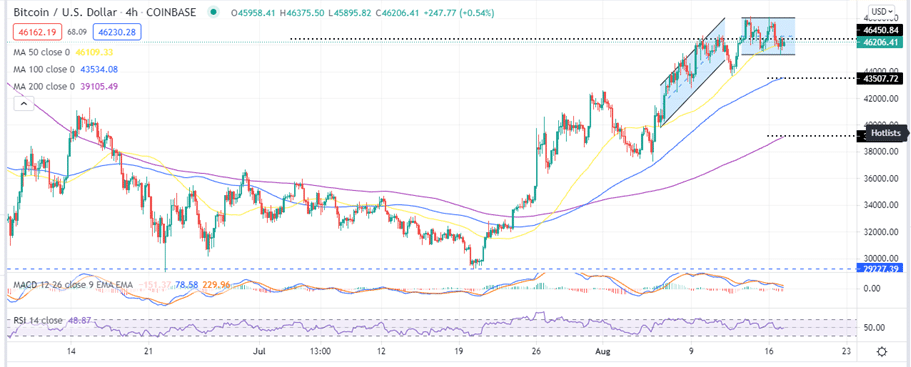
The $46,500 Mark Crucial For a Bullish Breakout
Analysists say that flipping a breakout above the middle line of the rectangle pattern at $46,500 is crucial to Bitcoin restarting the bullish leg. According to crypto analyst at Rekt Capital, the Bitcoin price needs to flip the $46,500 level into support to rally to areas above $50,000.
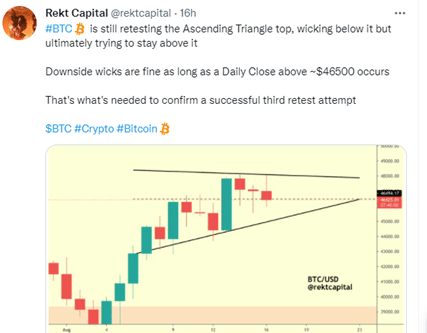
As seen on the four-hour chart as well as the daily chart by Rekt Capital, Bitcoin price action formed an ascending triangle and BTC needs to close above the tip of the rising channel which coincides with the rectangle’s upper boundary at $48,050. For this to happen, BTC has to turn $46,500 into support.
If this happens, Bitcoin’s bullish breakout will be validated which could renew hope of surpassing the $50,000 psychological level and recording new all-time high’s above $65,000.
A technical outlook from the Moving Average Convergence Divergence (MACD) and the Relative Strength Index (RSI) indicators validate the bullish Bitcoin price prediction. The MACD’s position above the zero line in the positive region and the upward movement of the RSI away from the oversold zone are all bullish crypto signals.
Looking to buy or trade Bitcoin now? Invest at eToro!
Capital at risk
