- Bitcoin price slides under $30,000, leaving investors bleeding.
- Robust support, perhaps at $28,000, is required to keep BTC afloat.
- The short-term technical picture screams sell based on the MACD and the RSI indicators.
Bitcoin continues with the freefall started after the failed attempt at sustaining June highs above $41,000. The initial drop under $40,000 was expected to close the most recent CME gap to $37,000. However, BTC failed to recover the ground, adding credence to the bearish outlook.
Bitcoin Price Selloff Intensifies Under $30,000
The ongoing downtrend kicked off amid rumors that China was purging Bitcoin and all crypto-related activities from its borders on Monday. A report published by Reuters said that China’s central bank had a meeting with banks and gave instructions to freezing all payment channels supporting Bitcoin trading.
As the news reverberated in the market, Bitcoin resumed the downtrend, wiping all the accrued gains in the second week of June. The crash on Monday took a pit stop at $31,000, but recovery attempts failed to rise above $33,000.
Meanwhile, overhead pressure soared as bulls bowed, leaving the crucial levels at $31,000 and $30,000 vulnerable. At the time of writing, Bitcoin teeters at $29,800 amid massive bearish signals.
Support is expected at $28,000, which may trigger immense sell orders and investor panic if broken. Besides, all technical levels and indicators point toward a potentially massive downswing in the coming sessions.
Why Bitcoin Price Downtrend Seems Unstoppable
The Moving Average Convergence Divergence (MACD) indicator has a bearish signal. The momentum indicator recently failed to cross above the zero line, a move that could have bolstered the bellwether cryptocurrency significantly upward. However, with the MACD line (blue) crossing beneath the signal line on the daily chart, BTC’s path with the slightest resistance is likely to remain downward in the coming sessions.
BTC/USD Daily Chart
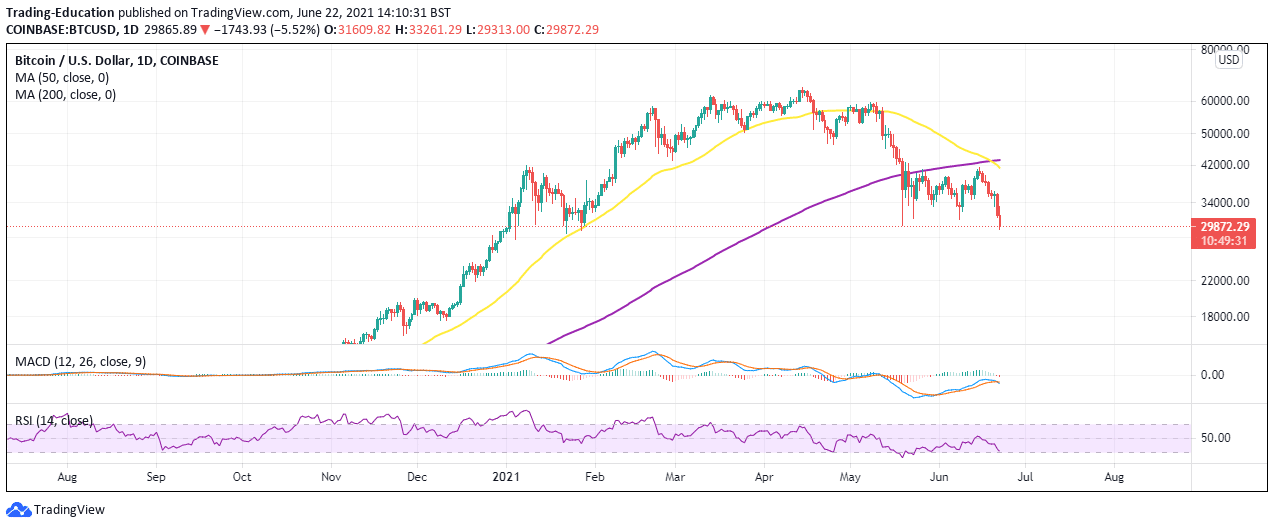
The Relative Strength Index (RSI) adds credibility to the downtrend based on the sharp retreat from the midline to the oversold area. Note that this tool follows the direction of the trend and measures its strength. A sharp move as this implies that bears are very aggressive.
A comprehensive look at the In/Out of the Money Around Price (IOMAP) on-chain model by IntoTheBlock adds weight to the ongoing breakdown. The model reveals that support areas have weakened and are vulnerable to losses. Hence, Bitcoin price is at a higher probability of diving further.
Bitcoin Price IOMAP Chart
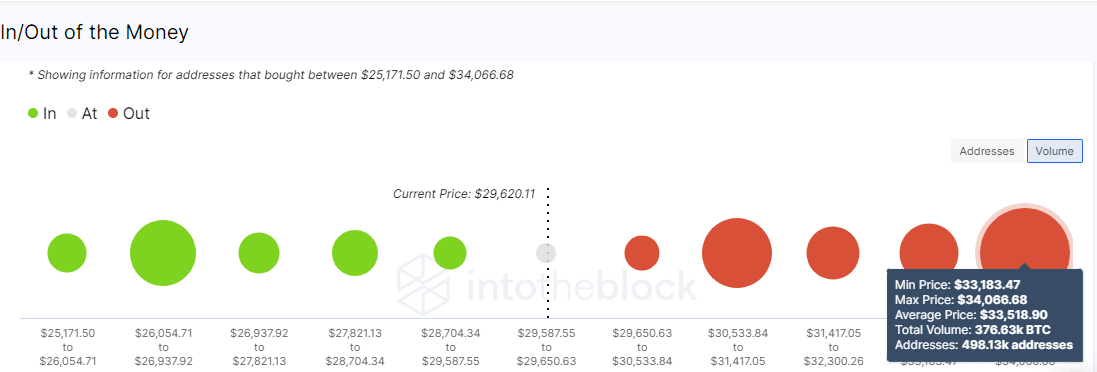
On the upside, recovery will not be as quickly as investors would wish because of the massive resistance highlighted between $33,183 and $34,066. Therefore, if the technical support at $28,000 fails to hold, Bitcoin price may stretch the bearish leg toward $20,000.
67% of retail investor accounts lose money when trading CFDs with this provider. You should consider whether you can afford to take the high risk of losing your money.