- Bitcoin price holds firmly in a narrow range with support at $10,200 and resistance at $10,400.
- Bitcoin price is in consolidation, but IntoTheBlock on-chain data shows that recovery above $11,000 is in the offing.
The flagship cryptocurrency traded above $10,000 the weekend over, but again, not much action was encountered to the upside. Support at $10,000 remained intact, and so did the resistance at $10,400. At the moment, Bitcoin is trading at $10,233 after losing a subtle 0.21% of its value on the day. There have been many instances when BTC has traded above $10,300. However, it failed to test the hurdle at $10,400, just like the intraday high at $10,312 (Coinbase) traded during the Asian session.
The pioneer digital asset suffered a massive blow to the uptrend it had sustained for more than a month towards the end of last week. Before the breakdown, Bitcoin was pivotal between the broken support at $11,100 and the critical $12,000. Gains above $12,000 became unstainable, exhausting the buyers hence the freefall to levels slightly under $10,000.
On the daily chart, Bitcoin price is doddering below a long term ascending trendline. Intriguingly, BTC has encountered immense support at $10,000. The support seems to have helped BTC avert the bearish call (close the CME BTC futures gap to $9,600) discussed on Friday.
As traders and investors scratch their heads in a bid to identify the direction Bitcoin would take, it is essential to realize that technical indicator such as the Relative Strength Index (RSI) point towards sustained consolidation before a breakout. The RSI is an index that illustrates how strong a particular trend is. In this case, the sideways movement at 37.50 hints that BTC/USD will remain range-bound between short term support at $10,200 and the resistance at $10,400, at least for the near term.
BTC/USD daily chart
%20(34)-637350482002834982.png)
Meanwhile, on-chain data provided by IntoTheBlock, particularly the “Out of the Money” model, confirms that Bitcoin is unlikely to drop further. Instead, the largest cryptocurrency is bound to resume the rally to levels above $11,000. In other words, the model shows that about 992,000 addresses purchased Bitcoin at a minimum price of $10,381 and a maximum price of $11,008. On average, these addresses bought BTC at $10,698. With Bitcoin trading at $10,251, this means that these addresses are likely to hold onto the crypto in anticipation that the price will increase so that they can sell higher.
In/Out of money chart
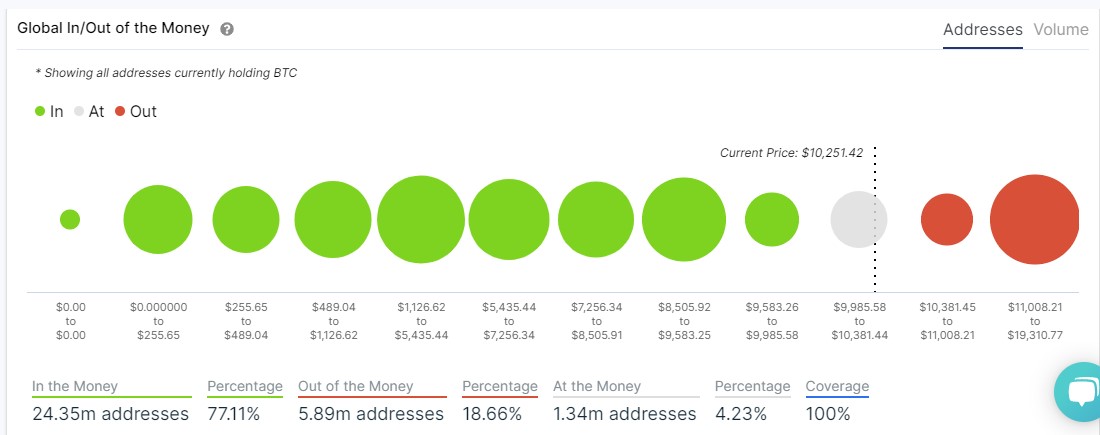
On the downside, Bitcoin has been accorded immense support by the 1.34 million addresses that bought the token at an average price of $10,220. It means that these addresses are still in the money, but the margin is not big enough to call for a massive selloff. Therefore, According to these metrics, the digital gold path of least resistance seems to be upwards.
Besides, the price is generally trading between the moving average support and resistance. The 50-day SMA will limit recovery at $11,166 while the 200-day SMA is in line to provide support marginally above $9,000. Similarly, the gap made by the 50 SMA above the longer-term 200 SMA hints that bulls have not lost it all and still have some influence over the price, probably enough to send BTC above the resistance at $10,400.
