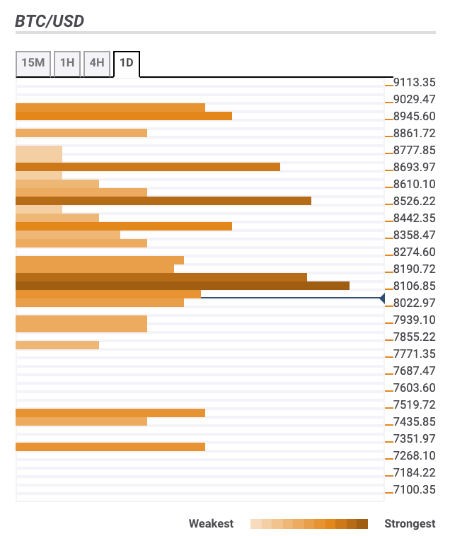
- BTC/USD managed to settle above $8,000, but the recovery is limited.
- Bears may regain control in the short-run.
BTC/USD hovers marginally above $8,000 after a short-lived dip to $7,990 on Tuesday. A sustainable move below this psychological barrier will trigger a sharp sell-off and take the price to $7,800-$7,7000 area. At the time of writing, BTC/USD is changing hands at $8,060, mostly unchanged both on a day-to-day basis and since the beginning of Tuesday.
Bitcoin confluence levels
Looking technically, there are a lot of barriers clustered above the current price, which means that the recovery may be limited. Let’s have a closer look at the technical levels that may serve as resistance and support areas for the coin.
Resistance levels
$8,150 – 38.2% and 61.8% Fibo retracement daily, the middle line of 1-hour Bollinger Band, a host of short-term SMAs (Simple Moving Average)
$8,350 – SMA100 1-hour, 161.8% Fibo projection
$8,500 – SMA50 (Simple Moving Average) daily, 61.8% Fibo retracement monthly, SMA200 1-hour
$8,700 – 38.2% Fibo retracement weekly
Support levels
$7,900 – Pivot Point 1-week Support 2, the lower line of 4-hour Bollinger Band
$7,500 – Pivot Point 1-month Support 1
$7,300 – The lowest level of the previous month.

