BTC/USD is range-bound amid growing bearish sentiments.
A sustainable move below $8,050 will take the price to $7,800.
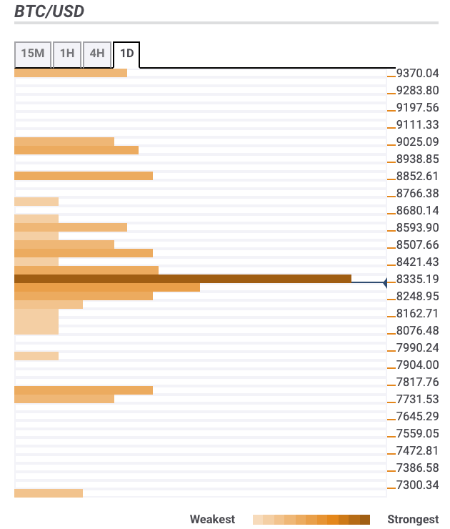
Bitcoin (BTC) cannot escape a narrow range of recent days. At the time of writing, BTC/USD is changing hands marginally below $8,300 level, little changed both on a day-on-day basis and since the beginning of the day.
Read also: Bitcoin futures attract increasingly more interest from large investors – CME Group
Bitcoin confluence levels
During early Tuesday hours, BTC/USD ventured a move above $8,400 and touched the intraday high of $8,417. However, the momentum faded away and the coin slipped back below $8,300 by press time. There are a few technical levels both below and above the current price, though the move to the South looks like a path of least resistance.
Let’s have a closer look at the technical levels that may serve as resistance and support areas for the coin.
Resistance levels
$8,400 – the middle lines of Bollinger Bands on one hour and 15-min timeframes, a host of short-term SMA levels the highest level of the previous four-hour and one-hour timeframes.
$8,450 -$8,500 – 23.6% Fibo retracement monthly, the upper line of four-hour Bollinger Band, 38.2% Fibo retracement weekly;
$8,700 – SMA200 (Simple Moving Average) daily;
$9,000 – psychological level, SMA2000 (Simple Moving Average) four-hour, 38.2% Fibo retracement monthly.
Support levels
$8,250 – the middle line of one-day Bollinger Band, the lower line of one-hour and 15-min Bollinger Bands, 61.8% Fibo retracement daily;
$8,050 – Pivot Point one-day Support3;
$7,800 – the lowest levels of the previous week, Pivot Point one-week Support 1.