- BTC/USD went down from $10,269.35 to $10,215.50 so far this Tuesday.
- Bitcoin has two healthy support levels on the downside, as per the daily confluence detector.
Bitcoin is on course for charting its fifth straight bearish day in a row. So far this Tuesday, the price has gone down from $10,269.35 to $10,215.50. Over the previous five days, the price of BTC/USD has dropped from $10,428.45 to $10,215.50, charting a 2% fall in price. The daily confluence detector shows that there is a stack of resistance levels that stopping re-entry into the $10,300 zone.
BTC/USD daily confluence detector
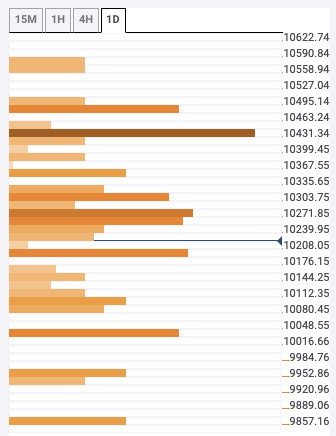
On the upside, resistance levels lie at $10,265 – $10,285, $10,440 and $10,490. $10,265-$10,285 has the 5-day simple moving average (SMA 5), SMA10, SMA 50, SMA 100, SMA 200, 15-min previous high, 15-min Bollinger band middle curve, 1-day Fibonacci 61.8% retracement level and 1-hour previous high. $10,440 has the SMA 100, while $10,490 has the 1-month Fibonacci 38.2% retracement level.
On the downside, support levels lie at $10,185 and $10,025. $10,185 has the 15-min previous low, 1-hour previous low, SMA 50, 1-day Fibonacci 38.2% retracement level and 1-day Bollinger band middle curve. $10,025 has the 1-month Fibonacci 23.6% retracement level.
