- The past two months saw Bitcoin gradually thin towards $10,000.
- Bitcoin price drop to $9,300 was necessary for the next rally above $10,000.
Bitcoin price continues to attract buy orders as investors take their positions in anticipation of the next parabolic leg. The past two months saw Bitcoin gradually thin towards $10,000. Unfortunately, $10,000 level gave way to losses. The lower leg refreshed lows close to $9,300 before the ongoing recovery set in.
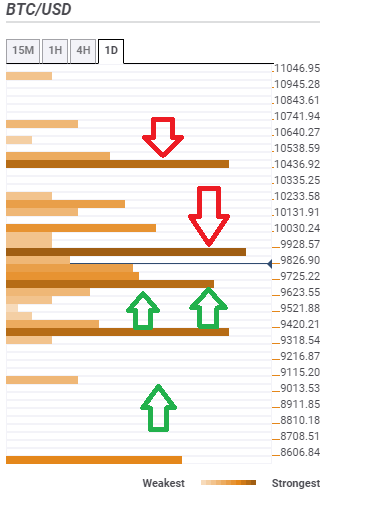
At press time Bitcoin is trading at $9,771 even as indecision continues to cloud the market. The first resistance is observed at $9,826 (confluence seller congestion zone). The cluster of indicators converging here range from the SMA 5 1-hour, Bollinger Band 15-mins Middle, SMA 10 15-mins, SMA 5 15-mins, previous high 15-mins, Bollinger Band 15-mins upper, previous high 1-hour and the previous high 4-hour.
If Bitcoin manages to rise above this barrier, the move will remain undeterred until it hits the next snag at $9,928. The various indicators meeting here include the Fibonacci 38.2% 1-week, previous high 1-day, Bollinger Band 1-hour upper, SMA 50 4-hour and SMA 200 1-hour.
The most significant resistance before $10,000 is $9,928. Correction above this level could complete the leg above $10,400 before closing in on the next strong resistance at $10,436.
On the downside, the available support areas are viable enough to prevent a slump to $9,000. The initial support is $9,725 and is highlighted by SMA 5 4-hour, Bollinger Band 1-hour Middle, 38.2% Fib 1-day, SMA 50 15-mins, SMA 200 15-mins SMA 5-day and the 61.8% Fib level 1-day among others. The second support at $9,420 will come in hand in the event declines gain momentum towards $9,000. If push comes to shove and $9,000 gives in to the selling pressure $8,606 will function as the next cushion zone.