BTC/USD is oscillation inside a tight range ahead of the breakthrough. The critical resistance is created by a psychological $10,000. Bitcoin (BTC) is sitting in a tight range between $9,800 and $9,400 since the start of the week. At the time of writing, BTC/USD is changing hands above $9,700, mostly unchanged both on a day-to-day basis and since the beginning of Wednesday. On the intraday charts, BTC is supported by 1-hour SMA50 (currently at $9,700), while the resistance is created by the intraday high $9,836. The ultimate bullish target is created by a psychological $10,000. The short-term momentum remains bearish, with the RSI on the intraday charts flat, which means, the coin may continue the moving inside the range. BTC/USD 1-hour chart 
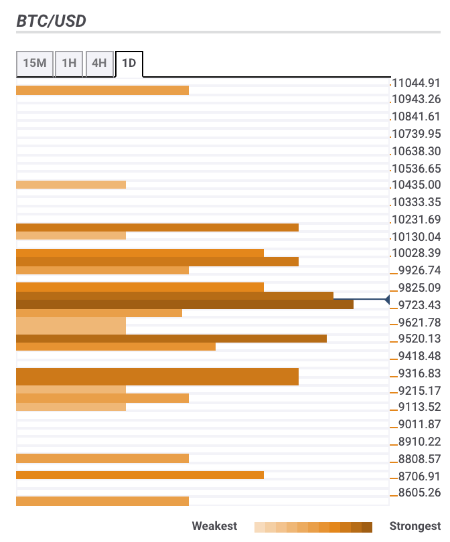
Let’s have a closer look at support and resistance levels clustered around the current price. Resistance levels $9,800-$9,850 – 23.6% Fibo retracement daily, the upper line of the 1-hour Bollinger Band, the highest level of the previous 4 hours $9,950-$10,000 – the highest level of the previous week, the upper line of the 4-hour Bollinger Band, Pivot Point 1-month Resistance 1 $10,200 – Pivot Point 1-week Resistance 1, Pivot Point 1-day Resistance 2 $10,500 – Pivot Point 1-day Resistance 3 Support levels $9,700 – 1-hour SMA50, the middle line of the 4-hour Bollinger Band $9,500 – the lower line of the 4-hour Bollinger Band, the highest level of the previous month $9,300 – Pivot Point 1-day Support 2, the middle line of the daily Bollinger Band, 4-hour SMA100, 61.8% Fibo retracement weekly $9,000 – Pivot Point 1-day Support 3. FX Street FX Street FXStreet is the leading independent portal dedicated to the Foreign Exchange (Forex) market. It was launched in 2000 and the portal has always been proud of their unyielding commitment to provide objective and unbiased information, to enable their users to take better and more confident decisions. View All Post By FX Street Crypto News share Read Next Bearish Triangle On USD Index Can Support GBPUSD – Elliott wave analysis Gregor Horvat 2 years BTC/USD is oscillation inside a tight range ahead of the breakthrough. The critical resistance is created by a psychological $10,000. Bitcoin (BTC) is sitting in a tight range between $9,800 and $9,400 since the start of the week. At the time of writing, BTC/USD is changing hands above $9,700, mostly unchanged both on a day-to-day basis and since the beginning of Wednesday. On the intraday charts, BTC is supported by 1-hour SMA50 (currently at $9,700), while the resistance is created by the intraday high $9,836. The ultimate bullish target is created by a psychological $10,000. The short-term momentum remains bearish,… Regulated Forex Brokers All Brokers Sponsored Brokers Broker Benefits Min Deposit Score Visit Broker 1 $100T&Cs Apply 0% Commission and No stamp DutyRegulated by US,UK & International StockCopy Successfull Traders 9.8 Visit Site FreeBets Reviews$100Your capital is at risk. 2 T&Cs Apply 9.8 Visit Site FreeBets Reviews$100Your capital is at risk. 3 Recommended Broker $100T&Cs Apply No deposit or withdrawal feesTrade major forex pairs such as EUR/USD with leverage up to 30:1 and tight spreads of 0.9 pips Low $100 minimum deposit to open a trading account 9 Visit Site FreeBets ReviewsYour capital is at risk. 4 T&Cs Apply Visit Site FreeBets ReviewsYour capital is at risk. 5 Recommended Broker $0T&Cs Apply Trade gold, silver, and platinum directly against major currenciesUp to 1:500 leverage for forex trading24/5 customer service by phone and email 9 Visit Site FreeBets ReviewsYour capital is at risk.