- BTC/USD is currently trading for $8,130.
- The daily confluence detector shows a lack of healthy support levels.
The bears have full control of BTC/USD in the early hours of Friday. So far, the price has dropped from 8,234.30 to $8,130. Before this, BTC/USD had a bearish Thursday, wherein the price fell from $8,385 to $8,234. The hourly breakdown shows us that BTC/USD fell to $8,112.40 before the bulls took over and took the price up to $8,234.30. However, the bears seized back control and dropped the price from $8,234.30 to $8,130 within one hour, following which, BTC/USD has been trending horizontally.
BTC/USD daily confluence detector
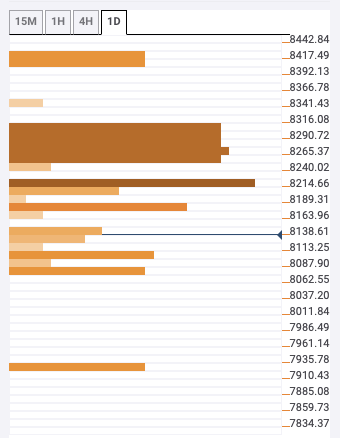
The daily confluence detector shows a lack of healthy support levels, so a further drop in price could be expected. On the upside, the bulls face stacks of massive resistance level. The strongest level is at $8,220, which has the five-day Simple Moving Average (SMA 5), one-hour Bollinger Band middle curve, and the one-day Fibonacci 38.2% retracement level.
There is a stack of strong resistances between $8,250 – $8,315. This stack sees a confluence of the one-hour previous high, SMA 50, SMA 200, SMA 10, SMA 5, 15-min Bollinger Band upper curve, four-hour previous high, one-week Fibonacci 23.6% retracement level, and one-day Fibonacci 61.8% retracement level.
