- After a significant sell-off yesterday on June 11, Bitcoin is trying to recover and keep the daily 26-EMA.
- BTC/USD is trading below the daily 12-EMA but was able to defend a long-term trendline.
Bitcoin was able to hold a long-term trendline formed back on March 12. This is a bullish sign but there are a few hurdles in the way of the bulls. Let’s take a closer look at the important resistance and support levels.
At $9,500, Bitcoin is facing the middle Bollinger Band on the daily chart and it’s also close to a 15-minute high. Further up, bulls will need to beat $9,547 where the weekly Fibonacci 23.6% is currently lying. Closer to $9,600, the SMA100 on the 4-hour chart will pose a strong resistance level.
In terms of support, it seems that Bitcoin has a good amount of support down to $9,300. The previous hourly high at $9,449 will serve as support. At $9,432, bulls can find the 15-minute SMA5, the hourly SMA10, and the 15-minute SMA50. More support can be found at $9,416 where the daily Fibonacci 38.2% and the 4-hour SMA5 are converging.
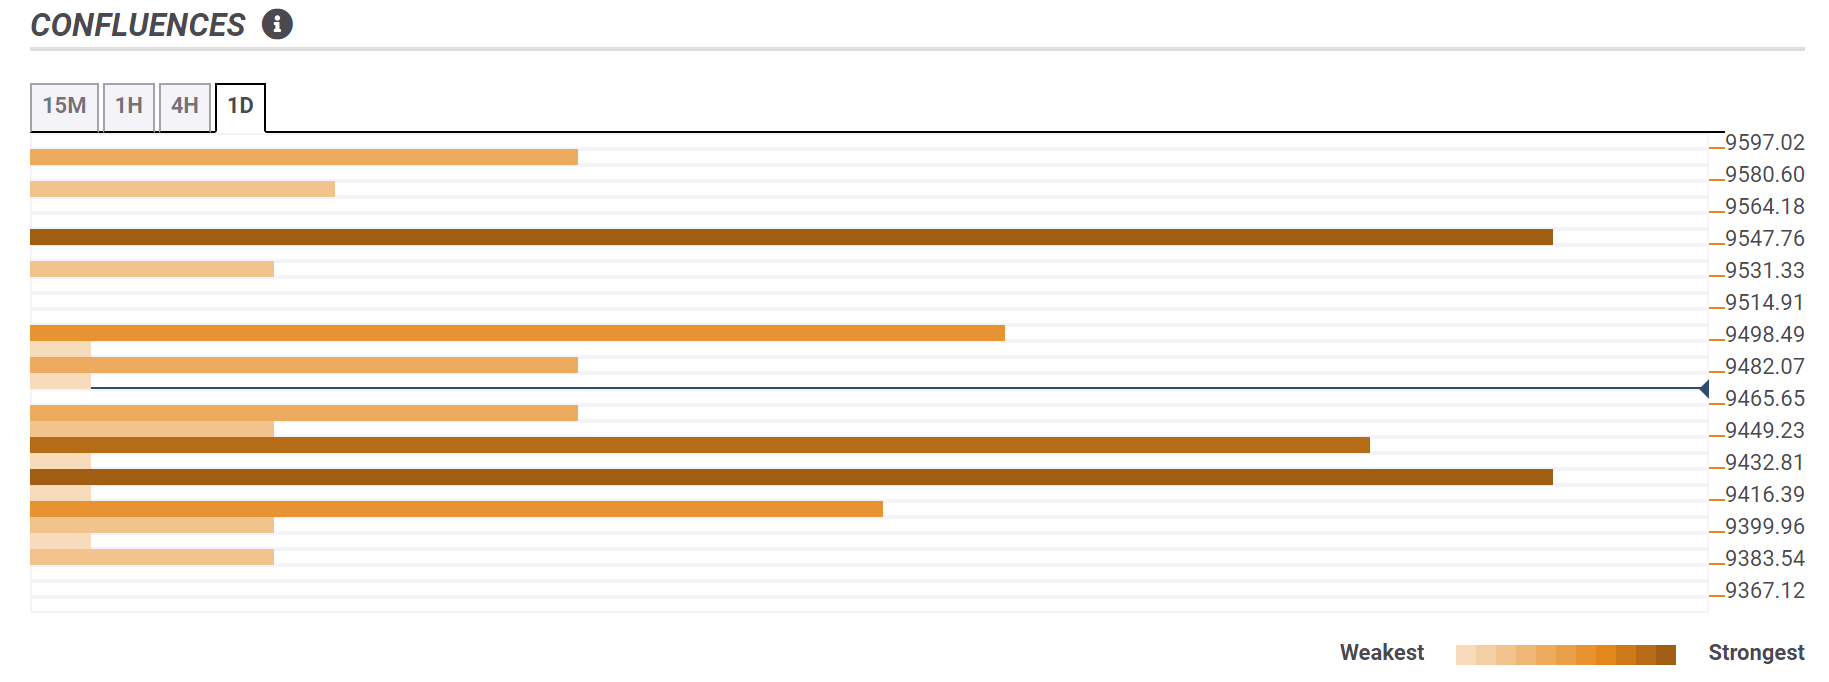
Confluence Detector
The Confluence Detector finds exciting opportunities using Technical Confluences. The TC is a tool to locate and point out those price levels where there is a congestion of indicators, moving averages, Fibonacci levels, Pivot Points, etc. Knowing where these congestion points are located is very useful for the trader, and can be used as a basis for different strategies.
This tool assigns a certain amount of “weight” to each indicator, and this “weight” can influence adjacent price levels. These weightings mean that one price level without any indicator or moving average but under the influence of two “strongly weighted” levels accumulate more resistance than their neighbors. In these cases, the tool signals resistance in apparently empty areas.
Learn more about Technical Confluence
