- BTC/USD dropped from $8,215.70 to $8,030.50 this Tuesday.
- The resistance level at $8,090 prevents any further upward movement.
After a brief foray into the $8,200-zone, BTC/USD had a hugely bearish Tuesday, wherein the price fell from $8,215.70 to $8,030.50. Since then, the bulls have tried to recover the price this Wednesday as BTC/USD has slightly improved to $8,037.55. The hourly chart shows us that BTC/USD soared to $8,288.50, where it met resistance and dropped to $8,037.55. The daily confluence detector lacks any visible support levels, so further drop can be expected.
BTC/USD daily confluence detector
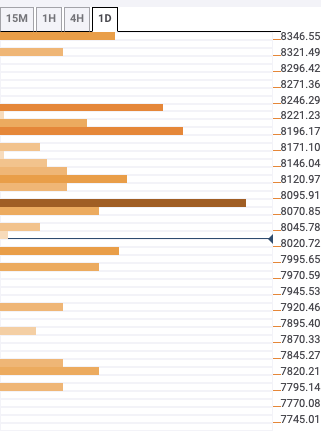
On the upside, the healthiest resistance level is at $8,090, which has the five-day Simple Moving Average (SMA 5), one-day Fibonacci 23.6% retracement level, and the 15-min Bollinger Band middle curve.
The second strongest resistance is at $8,200, which has the SMA 5, SMA 100, one-day Bollinger band, one-hour Bollinger band, and one-day Fibonacci 61.8% retracement level.
