- BTC/USD is rangebound ahead of $3,800.
- A move above $3,900 will create a positive impulse.
BTC/USD is consolidating gains after a sharp rise on Tuesday. The first digital coin came close to $3,900 resistance, but the upside momentum faded away amid speculative positioning on the market.
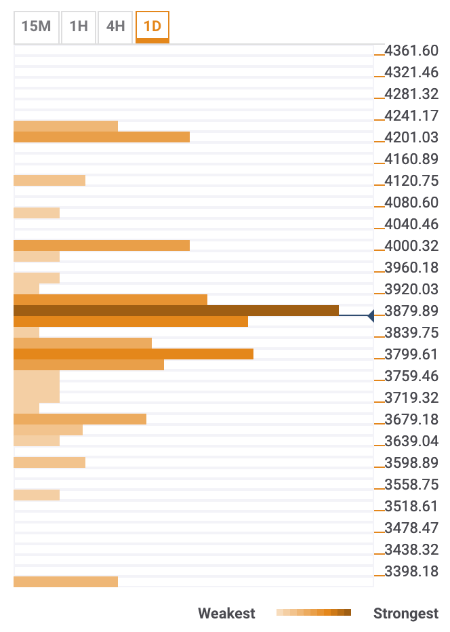
BTC/USD the daily confluence detector
A strong resistance area is spotted right above the current price. It is created by a confluence of technical indicators, including the upper boundary of 1-hour Bollinger Band, 38.2% Fibo retracement daily, weekly and monthly, and 23.6% Fibo retracement daily. We need a sustainable move above $3,900-$3,920 area to see an improvement of the short-term technical picture.
The next upside barrier is located at psychological $4,000 with Fibo 23.6% monthly and 61.8% Fibo retracement weekly located marginally above this area. The ultimate obstacle for the bulls lies with $4,200 preceded by the previous week and previous month high.
On the downside, the initial support area lies below the current price; It is created by a confluence of technical indicators, including SMA100, SMA10, and SMA5 4-hour, midline line of 1hour Bollinger Bands and Fibo retracement 61.8% daily.
However, even more critical barrier is seen on approach to $3,800. It is strengthened by SMA50 4hour, SMA200 1hour DMA5, Midline of 4hour and daily Bollinger Bands and 23.6% Fibo retracement weekly.
Once this area is out of the way, the sell-off may be extended towards $3,680 with Fibo retracement 61.8% monthly on approach.
A sustainable move below this area will push the price lower towards $3,400 with Pivot Point 1week Support 2 and Pivot Point 1month Support 1 located below this barrier.
BTC/USD, 1D