- Bitcoin price forms a symmetrical triangle pattern with a 22% breakout target of $42,000.
- The MACD and RSI technical indicators align in support of the impending BTC uplift.
Bitcoin price seems to be closing the gap to $35,000 after firmly holding support at $34,000″”the uptrend from areas marginally under $33,000 allowed bulls to stamp their feet down. For now, all attention is directed to gaining ground above $36,000 and $40,000, respectively.
Bitcoin Price Symmetrical Triangle Breakout In The Offing
Bitcoin has in a couple of months stretch consolidation levels. The crucial support and resistance have led to the formation of a symmetrical triangle that a massive uptick may succeed.
The symmetrical triangle is created using two trend lines connecting sequential lower highs and higher lows. As the trend lines converge at a roughly equal point, consolidation takes precedence. A low trading volume characterizes the sideways trading action.
However, a Bitcoin buy signal is expected to break out before the line meet. Note that the price must crack the upper trend line to affirm the uptrend. Moreover, a spike in trading volume helps to validate the upswing. BTC’s 22% target above $42,000 is measured by measuring the distance between the widest points of the triangle.
Bitcoin Price Four-Hour Chart Draws Near A Breakout
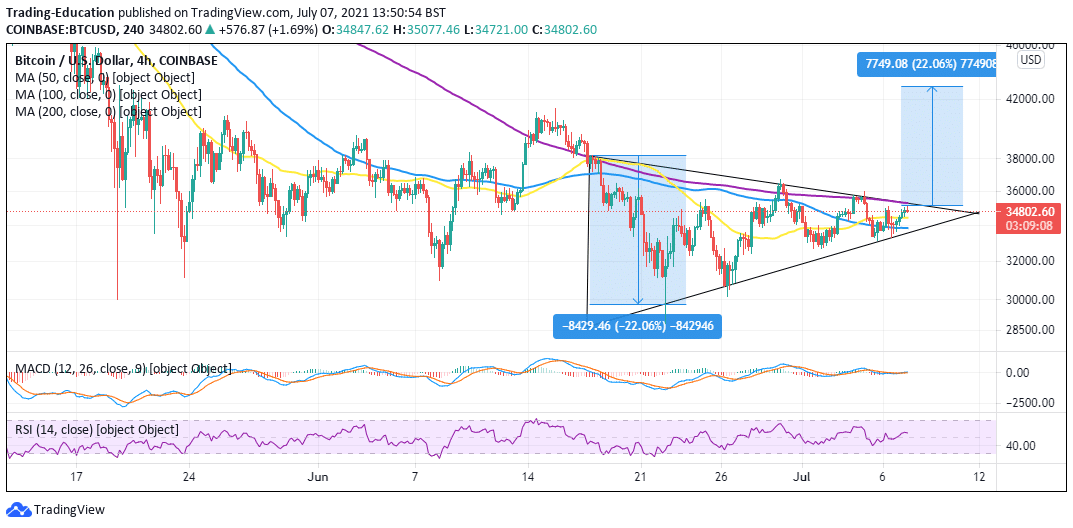
The ongoing price action is upward but gradual and reinforced by the Moving Average Convergence Divergence MACD) indicator. Traders use this trend-following tool to foresee the direction the asset is likely to take. The MACD also takes into account the momentum of the trend, sending out buy or dell signals.
When the 12-day exponential moving average (EMA) crosses above the 26-day EMA, a call to buy appears. Realize that the upswing will be confirmed as the MACD rises above the mean line (0.00) into the signal line.
The same bullish outlook has been emphasized by the Relative Strength Index (RSI) in the exact timeframe. If the RSI settles above the midline and closes the gap toward the mean line, we will see the bullish grip get more aggressive.
What Could Sabotage Bitcoin’s Potentially Massive Breakout?
It is worth mentioning that the breakout to $42,000 will fail to materialize if the triangle’s upper trend line resistance fails to break. On the downside, the 50 SMA and 200 SMA support areas have to hold to avert potential losses.
A confirmed breakout beneath the lower trend line may validate the beginning of a downtrend. It is worth noting that a symmetrical triangle has both bullish and bearish impulses. Support zones are expected at $32,000 and $30,000, but Bitcoin could stretch the bearish leg far, much downhill.
Capital at risk