- BTC/USD is in dormancy, waiting for something to happen.
- The range is the same: $3,800-$3,900.
No wonder that we cannot proceed any further from where we are. The market is stuck between a rock and a hard place. Lack of focus on fundamentals and purely speculative trading makes it hard to foresee the movements.
However, one thing is sure: a sustainable breakthrough in either direction will set the ball rolling. BTC has been sitting in a tight range for too long, building momentum and waiting for an opportunity.
At the time of writing, BTC/USD is changing hands at $3,840, mostly unchanged in recent 24 hours.
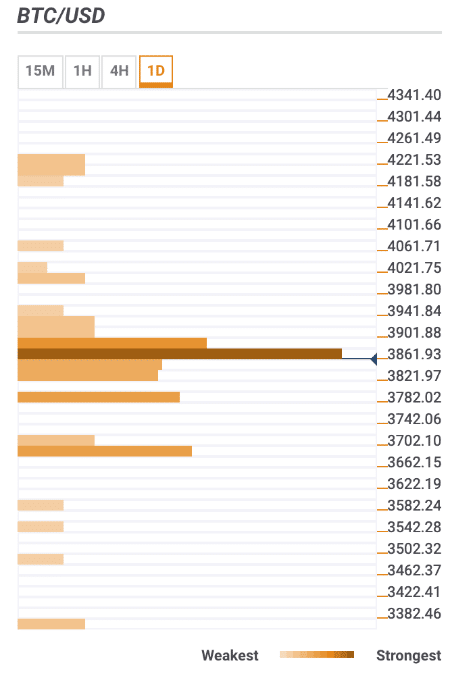
BTC/USD the daily confluence detector
The resistance zone above the current price thickens. It goes all the way up to $3,920 and serves as a substantial barrier for BTC bulls. This area contains a series of significant technical including:
- Midline Bollinger Band on 1-hour, 4-hour and daily charts, the upper boundary of 1-hour Bollinger Band, upper and middle line of 15-min Bollinger Band.
- A series of significant SMA levels including SMA200 and SMA100 (1-hour), DMA5 and DMA10, SMA50 (4-hour) and a host of 15-min SMA levels.
- Fibo retracement levels (38.2% daily and monthly, 23.6% weekly. 61.8% daily)
Once we manage to plow through, $4,000 and $4,200 will jump back into focus with very little in terms of resistance levels that may stop the upside. Most likely, the decisive breakthrough will result in a strong upside movement.
Below the current price, the support is created by SMA100 (4-hour), 23.6% Fibo retracement daily, 38.2% Fibo retracement weekly, lower boundaries of 1-hour and 4-hour Bollinger Bands.
A move below those barriers will take us under $3,800 with the next support seem around $3,700. It is created by DMA50, the lower line of daily Bollinger Band and 61.8% Fibo retracement monthly
BTC/USD, 1D