- BTC/USD is enjoying the support from the 100 SMA 4-hour currently at $3,848.51.
- The still lack the support and a catalyst to sustain growth above $3,900 and retrace towards $4,000.
BTC/USD is seen trading at $3,869 at press time following a 0.35% upside correction ahead of the weekend session. The price has spent the last couple of weeks trying to recover from the devastating crash on February 25. Before the drop, BTC/USD had explored the levels close to $4,200. The sharp drop could not find support at $4,000 neither did $3,800 and $3,700 levels help stop the declines.
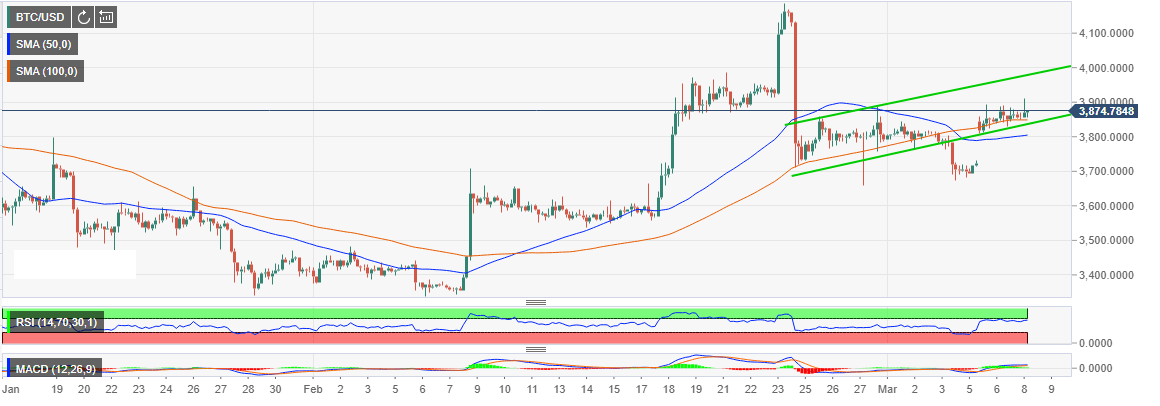
The asset found support $3,660.33 before staging a recovery that is currently forming a bearish flag pattern as seen on the 4-hour chart. A bearish flag pattern means that unless the bulls sustain the upward move, the asset will continue with the bearish trend. Therefore, a reaction to the pattern could Bitcoin break the support at $3,800 which coincides with the 50 SMA and even test the next target at $3,700.
For now, BTC/USD is enjoying the support from the 100 SMA 4-hour currently at $3,848.51. The price is trending sideways in spite of the Relative Strength Index (SMA) brushing shoulders with the overbought. Moreover, the Moving Average Divergence Convergence (MACD) is holding ground in the positive region to show that the bulls have the influence. However, they still lack the support and a catalyst to sustain growth above $3,900 and retrace towards $4,000.
BTC/USD 4-hour chart